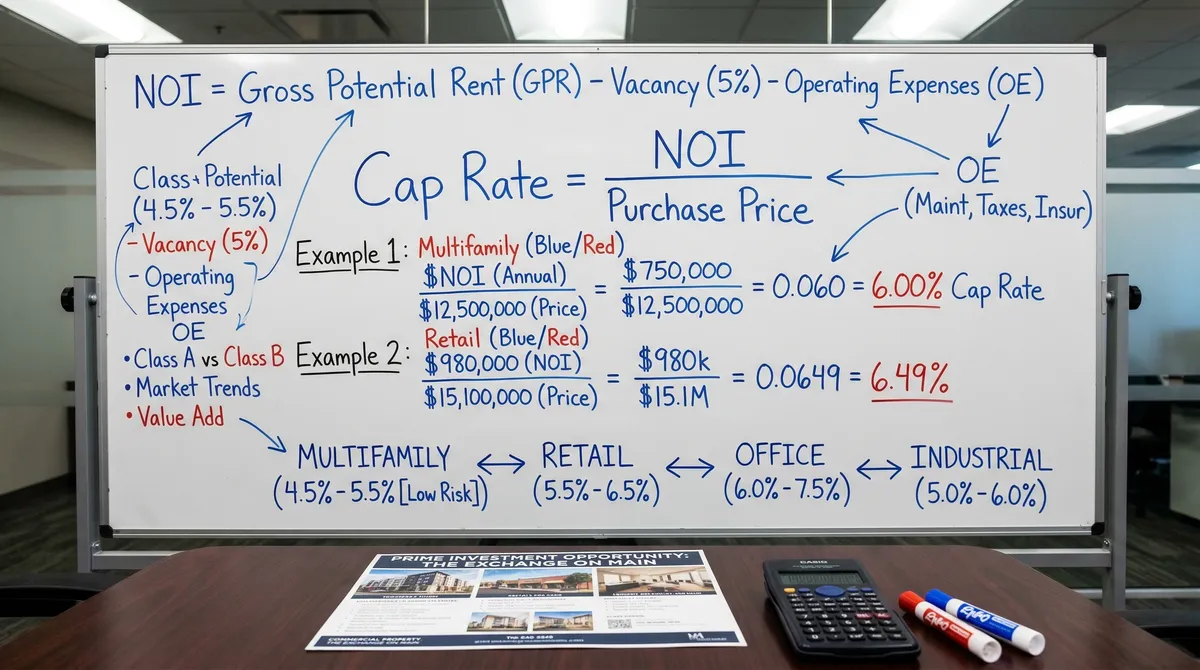
A capitalization rate (cap rate) is the ratio of a property's net operating income to its purchase price. It's the number I reach for first when I compare one commercial deal to another. Per CoStar Group, cap rates here in Central Massachusetts run from 5.5% for Class A multifamily to 9.5% for Class C office. That's 150 to 200 basis points of extra yield over the same asset in Greater Boston, and entry prices run 60 to 70% lower.
Cap Rate Formula: A 6.67% cap rate signifies $100,000 Net Operating Income (NOI) on a $1.5 million property, calculated as NOI divided by property value.
Yield Premium: Central Massachusetts offers investors 150-200 basis points of additional yield compared to equivalent assets in Greater Boston.
Industrial Performance: Central MA industrial cap rates range from 6.0-7.5%, significantly higher than Boston Metro's 4.5-5.5% as of early 2026.
Leverage Opportunity: Investors can achieve positive leveraged equity returns due to Central MA cap rates (6-8%) exceeding current commercial mortgage rates (low-to-mid 6%).
Capitalization Rate (Cap Rate) is the ratio of a property's net operating income (NOI) to its current market value or purchase price, representing the unleveraged annual return on an all-cash acquisition.
Cap rate formula: NOI / Property Value; a 6.67% cap rate means $100,000 NOI on a $1.5M property (CoStar Group)
Central MA yield premium: 150-200 basis points above Greater Boston across all property types (CoStar Group)
Industrial cap rates: 6.0-7.5% in Central MA vs. 4.5-5.5% in Boston Metro as of early 2026 (CoStar Group)
Positive leverage returning: Commercial mortgage rates in the low-to-mid 6% range with Central MA cap rates at 6-8%, enabling leveraged equity returns (Federal Reserve / Mortgage Bankers Association)
What a cap rate actually is
A cap rate is the ratio of a property's net operating income (NOI) to its purchase price or current market value. The formula is simple:
Cap Rate = Net Operating Income / Property Value
A property throwing off $100,000 in NOI at a purchase price of $1,500,000 has a cap rate of 6.67%. That's the unleveraged annual return you'd earn buying it all cash.
The formula is simple. What it's telling you isn't. A cap rate is a pricing signal, not just a return number. It carries risk, location, tenant quality, the shape the building is in, where interest rates sit, and how many buyers are chasing the same deal. Knowing what moves it is the difference between the investor who buys right and the one who overpays.
How cap rates work in practice
Cap rate and value move opposite each other
Cap rates and property values pull in opposite directions. When cap rates compress (go down), values go up. When cap rates expand (go up), values come down.
| Scenario | NOI | Cap Rate | Property Value |
|---|---|---|---|
| Compressed market | $100,000 | 5.0% | $2,000,000 |
| Neutral market | $100,000 | 6.5% | $1,538,462 |
| Expanded market | $100,000 | 8.0% | $1,250,000 |
Same income stream, three different cap rates, a $750,000 difference in property value. That's why a small move in cap rates swings value so hard, and why investors watch where cap rates are headed as closely as they do.
What NOI actually means
Net Operating Income is gross rental income minus operating expenses. It does not include debt service (mortgage payments), capital expenditures, or depreciation. The pieces:
Income side:
- Base rent from tenants
- Expense reimbursements (NNN pass-throughs)
- Other income (parking, storage, signage, percentage rent)
- Less: vacancy and credit loss allowance
Expense side:
- Property taxes
- Insurance
- Common area maintenance (CAM)
- Management fees (typically 3-6% of gross income)
- Utilities (if not tenant-paid)
- Repairs and maintenance
Pro tip: Verify the NOI yourself. Seller pro formas tend to lowball expenses or plug in projected rents instead of the rents actually in place. Rebuild the NOI from actual operating statements, tax bills, and insurance quotes, and your cap rate will be right.
Where Central Massachusetts cap rates sit now
Cap rates move a lot by property type, location, and quality. Here's where the Central Massachusetts market stands as of early 2026.
By property type
| Property Type | Cap Rate Range | Avg. Price/SF | Key Driver |
|---|---|---|---|
| Industrial / Warehouse | 6.0% - 7.5% | $80 - $150/SF | E-commerce logistics demand |
| Neighborhood Retail | 6.5% - 8.0% | $100 - $175/SF | Tenant credit and lease term |
| Medical Office | 6.0% - 7.0% | $150 - $250/SF | UMass Health system expansion |
| Multifamily (5+ units) | 5.5% - 7.0% | $120 - $200/unit K | Housing shortage driving rents |
| Office | 7.5% - 9.5% | $60 - $120/SF | Remote work headwinds persist |
| Flex / R&D | 6.5% - 8.0% | $80 - $130/SF | Life sciences demand emerging |
By location within Worcester County
| Submarket | Typical Cap Rate Premium vs. Worcester | Why |
|---|---|---|
| Downtown Worcester | Baseline | Largest tenant pool, institutional demand |
| Route 9 Corridor (Auburn) | +25-50 bps | Strong retail but suburban risk |
| Spencer / Leicester | +75-125 bps | Lower liquidity, longer lease-up periods |
| Southbridge / Webster | +100-150 bps | Secondary market, smaller tenant pool |
| Route 146 Corridor | -25-50 bps | New institutional-grade industrial product |
How Central MA compares to Boston
This is the comparison that matters if you're deciding where to put money in Massachusetts:
| Metric | Boston Metro | Central MA (Worcester) | Spread |
|---|---|---|---|
| Industrial cap rate | 4.5% - 5.5% | 6.0% - 7.5% | +150-200 bps |
| Retail cap rate | 5.0% - 6.5% | 6.5% - 8.0% | +150 bps |
| Multifamily cap rate | 4.0% - 5.0% | 5.5% - 7.0% | +150-200 bps |
| Price per SF (industrial) | $250 - $400 | $80 - $150 | 60-70% discount |
Central Massachusetts pays you 150-200 basis points more yield than the same asset in Greater Boston. That premium is your compensation for thinner liquidity and a smaller tenant pool. For a buyer who knows this market, it's a good trade on a risk-adjusted basis.
What pushes cap rates up or down
If you want to make a smart call on price, you have to know what's driving the cap rate.
Factors that compress cap rates (lower cap = higher value)
- Strong tenant credit: A 10-year NNN lease with a national tenant (Dollar General, CVS, Starbucks) commands a lower cap rate than a local tenant on a 3-year lease
- Longer lease terms: A property with 8+ years of remaining lease term prices tighter than one with 2 years left
- Prime location: Highway visibility, strong demographics, and established commercial corridors compress caps
- Lower interest rates: As borrowing costs decline, more buyers compete for yield, compressing cap rates
- Institutional demand: When larger funds target a market, pricing tightens
- Recent renovations: Updated HVAC, roof, and code-compliant properties trade at lower cap rates
Factors that expand cap rates (higher cap = lower value)
- Deferred maintenance: Needed roof, HVAC, or environmental work expands cap rates
- Short remaining lease term: Upcoming vacancy risk demands higher returns
- Tenant concentration: Single-tenant or single-industry properties carry re-leasing risk
- Secondary locations: Properties off main corridors or in declining trade areas trade at higher caps
- Rising interest rates: Higher borrowing costs require higher cap rates to maintain positive leverage
- Environmental concerns: Phase I/II issues expand cap rates, sometimes dramatically
How to put cap rates to work in your analysis
1. Screening tool, not the final answer
Cap rates are good for a fast comparison. If two industrial buildings in the same submarket trade at 6.5% and 8.5%, that 200 basis point gap is telling you one of two things: either the cheaper building is overpriced, or the higher-cap one has a problem worth digging into (deferred maintenance, a lease rolling over, an environmental issue).
Use the cap rate as your first filter, not your decision. Then get into the NOI line by line and walk the building.
2. Calculating your offer price
To back into an offer price from a target cap rate:
Property Value = NOI / Target Cap Rate
If a property generates $85,000 in NOI and your target return is 7.25%:
$85,000 / 0.0725 = $1,172,414
That's the most you can pay and still hit a 7.25% unleveraged return. Knock it down for capital you'll have to put in or lease-up costs you'll carry.
3. Going-in vs. stabilized cap rate
- Going-in cap rate: Based on current NOI at the time of purchase. This is what you are actually buying.
- Stabilized cap rate: Based on projected NOI after lease-up, rent increases, or value-add improvements. This is what you are building toward.
The gap between going-in and stabilized is where value-add buyers make their money. Buy a half-vacant retail center at a 9% going-in cap and lease it up to a 7% stabilized cap, and you've created real value:
| Metric | Going-In | Stabilized |
|---|---|---|
| NOI | $100,000 | $175,000 |
| Cap Rate | 9.0% | 7.0% |
| Value | $1,111,111 | $2,500,000 |
That's a $1.4 million value increase, coming from both the NOI growth and the cap rate compression.
4. Cap rate vs. cash-on-cash return
Cap rate is the unleveraged return. Cash-on-cash is what you actually earn on the equity you put in, after debt service. Once you add a loan, cash-on-cash can land above or below the cap rate depending on your terms.
Positive leverage: When the cap rate is higher than your cost of debt, borrowing works for you. A 7% cap rate property financed at 6% throws off positive leverage, and adding debt lifts your equity return.
Negative leverage: When the cap rate is below your cost of debt, borrowing works against you. That was the story in 2023-2024, when rates ran past 7% while cap rates on quality assets sat in the 5-6% range.
As of early 2026, with commercial mortgage rates easing into the low-to-mid 6% range and Central MA cap rates running 6-8%, positive leverage is returning for most property types in the Worcester market.
What a good cap rate looks like in 2026
There's no such thing as a universally "good" cap rate. The right one depends on what you're trying to do:
| Investor Profile | Target Cap Rate | Strategy |
|---|---|---|
| Core / income-focused | 5.5% - 6.5% | Long-term holds, credit tenants, stable income |
| Core-plus | 6.5% - 7.5% | Modest value-add, mark-to-market rent upside |
| Value-add | 7.5% - 9.0% | Active management, lease-up, capital improvements |
| Opportunistic | 9.0%+ | Distressed acquisitions, repositioning, development |
For Central Massachusetts specifically, here's what's on the board right now:
- Core investors find good options in the 6-7% range for stabilized industrial and anchored retail
- Value-add investors have plenty of 7.5-9% properties with lease-up potential to work with
- Opportunistic buyers find distressed office and repositioning plays above 9%
Cap rate mistakes I see people make
1. Comparing cap rates across different property types. A 7% cap on an office building is not the same as a 7% cap on an industrial building. The risk underneath them is completely different.
2. Using pro forma NOI instead of actual NOI. Sellers market on projected income. You should underwrite on the actual trailing-12-month operating statements.
3. Ignoring capital expenditure requirements. A low-cap property that needs $200,000 in deferred maintenance is not a better buy than a higher-cap property in good shape.
4. Treating cap rates as static. Cap rates move with the market, with interest rates, with supply and demand. The 5% cap rate of 2021 is not the 7% cap rate of 2024. Underwrite to today, not to what a deal would have traded at a few years ago.
5. Forgetting about leverage. The cap rate is an unleveraged number. What you actually take home depends on your financing, which can add to it or eat into it.
The bottom line
Cap rates are how commercial real estate gets priced. In Central Massachusetts right now, you've got a combination that doesn't come along often: a 150-200 basis point cap rate premium over Greater Boston, financing that's getting easier, and solid fundamentals in industrial, retail, and multifamily.
For an investor who can read a cap rate and not just calculate one, Worcester County has some of the best risk-adjusted returns in New England.
""Cap rates are the most important metric in commercial real estate, but they are frequently misunderstood. A low cap rate does not mean a bad deal, and a high cap rate does not mean a good one. What matters is the relationship between the cap rate, the cost of capital, and the quality of the income stream," says **Todd Lornell**, Principal & Founder, Lornell Real Estate
Lornell Real Estate provides cap rate analysis and investment advisory services across Worcester County and Central Massachusetts. Contact our team at (860) 305-7432 to discuss specific properties and current market pricing.
Limitations: Cap rates, pricing, and transaction volume cited reflect market-level averages at the time of publication and may not apply to individual properties. Property values depend on asset-specific factors including condition, tenant credit quality, lease terms, location, and financing structure. Tax rules (including 1031 exchange provisions, capital gains rates, and depreciation schedules) change with legislation. This article does not constitute investment, tax, or legal advice. Consult a qualified CPA, attorney, and commercial real estate broker before making transaction decisions.
Sources & References
- CoStar
- CoStar Group
- Federal Reserve
- Mortgage Bankers Association
This article cites data from the sources listed above. For the most current figures, consult the original publications directly.
Data current as of publication date. Market conditions, rates, and regulations may have changed. Consult a qualified commercial real estate professional before making investment decisions.
Get the full Central MA market data
Commercial tax-base growth, development activity, and demographics across Central MA, town by town.