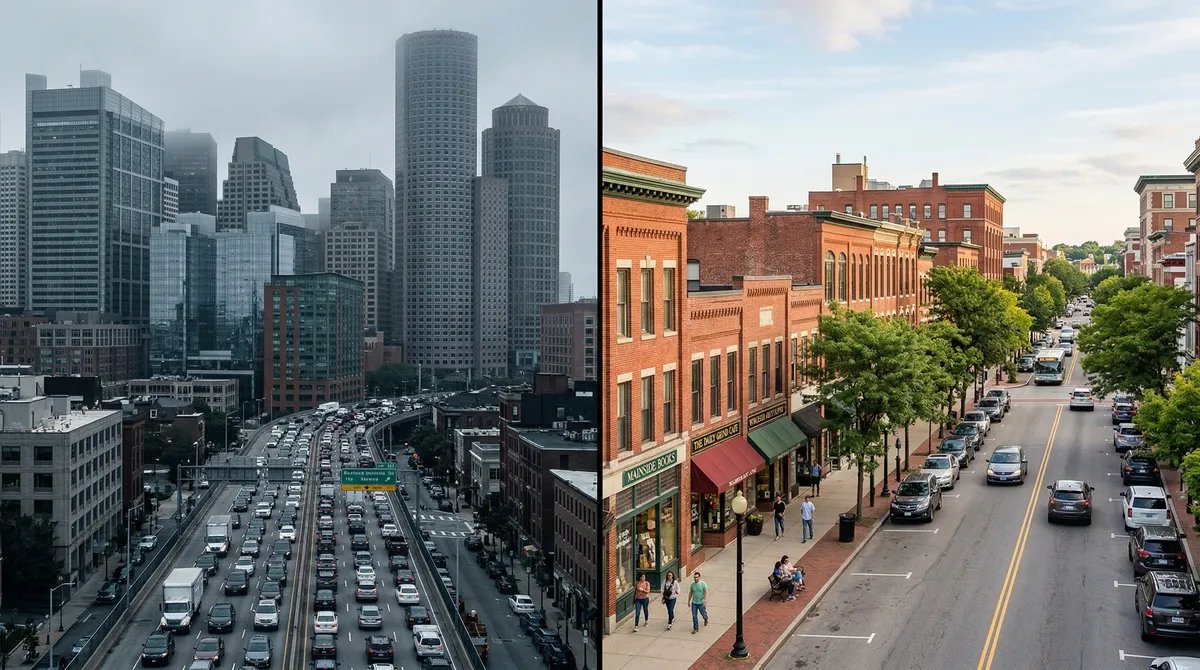
Central Massachusetts micro-markets consistently deliver superior risk-adjusted returns compared to Boston, with cap rate spreads of 150-250 basis points and total returns averaging 14.3% versus Boston's 11.0% over the past decade. According to CoStar Group, Central MA industrial vacancy sits at just 4.2% while offering entry points as low as $2-5 million compared to Boston's $25-50 million institutional minimums.
Better returns: Central MA micro-markets ran a 14.3% average annual return and a 2.75 Sharpe ratio over the past decade, ahead of Boston's 11.0% return and 1.29 Sharpe ratio.
Higher yield: Central MA cap rates sit 150-250 basis points above Boston across every property type, so you buy in at a better current yield.
Lower ticket to get in: Boston's institutional deals start at $25-50 million. In Central MA you can be in at $2-5 million.
Cheaper to operate: Employers here pay a 20% lower average office salary and an 18% lower warehouse wage than Boston.
Office holding up: Central MA office vacancy is 12.5%, well under Boston's 17.2% historic high.
Cap rate is the ratio of a property's net operating income (NOI) to its current market value, representing its unlevered rate of return or yield percentage.
Cap rate spreads: 150-250 basis points higher than Boston across all property types (CoStar Group)
Total returns: 14.3% average annual return in Central MA vs. 11.0% in Boston Metro (NCREIF)
Lower volatility: Central MA Sharpe ratio of 2.75 vs. Boston's 1.29, indicating superior risk-adjusted performance (NCREIF)
Entry points: $2-5M minimum in Central MA vs. $25-50M in Boston for institutional-quality assets (CoStar Group)
Why I keep buying west of Boston
Every commercial real estate investor knows Boston. It's consistently ranked among the top 10 U.S. markets for institutional investment. But more of the buyers I talk to are looking 40 miles west to Central Massachusetts, where the numbers tell a different story.
The cap rate gap
The first thing you notice is the pricing.
| Property Type | Boston Metro | Central MA | Spread |
|---|---|---|---|
| Industrial | 4.5-5.0% | 6.0-6.75% | 150-175 bps |
| Retail | 5.0-5.5% | 6.5-7.5% | 150-200 bps |
| Office (Class A) | 5.5-6.0% | 7.0-8.5% | 150-250 bps |
| Multifamily | 4.0-4.5% | 5.5-6.5% | 150-200 bps |
"A 200 basis point cap rate spread on a $1M NOI property represents $2.5 million in additional value creation if cap rates converge or a significantly higher current yield if they don't.
Vacancy and absorption
Industrial:
- Boston Metro vacancy: 3.8%
- Central MA vacancy: 4.2%
- Absorption: Central MA has absorbed 2.5M SF over past 24 months
Retail:
- Boston Metro vacancy: 4.5%
- Central MA vacancy: 5.8%
- Trend: Central MA vacancy declining faster as suburban retail strengthens
Office:
- Boston Metro vacancy: 17.2% (historic high)
- Central MA vacancy: 12.5%
- Dynamic: Central MA office outperforming due to lower remote work impact
What the workforce costs
Here's what an employer pays to run a location in Central MA versus Boston.
| Metric | Boston Metro | Central MA | Advantage |
|---|---|---|---|
| Average Office Salary | $85,000 | $68,000 | 20% lower |
| Warehouse Wage | $22/hr | $18/hr | 18% lower |
| Commute Time | 32 min | 24 min | 25% shorter |
| Cost of Living Index | 148 | 112 | 24% lower |
A company can hold its margins out here and still pay a competitive local wage. That keeps tenants in place, which is what I care about as a landlord.
Getting goods in and out
The highway network out here does real logistics work.
Interstate Access:
- I-90 (Mass Pike): Direct to Boston, Albany, Buffalo
- I-290: Worcester bypass and connector
- I-190: North to Leominster and Route 2
- I-395: South to Connecticut
Reach Within 2 Hours:
- 8.5 million people
- Boston, Providence, Hartford, Springfield
- Boston Logan, Bradley, and T.F. Green airports
A distribution center in Worcester can serve all New England markets with same-day delivery capability at 25-30% lower real estate costs than Boston.
The colleges
Higher education keeps this economy steady.
| Institution | Enrollment | Focus |
|---|---|---|
| Worcester Polytechnic Institute | 7,000 | Engineering, Technology |
| Clark University | 3,400 | Liberal Arts, Geography, Psychology |
| Holy Cross | 3,100 | Liberal Arts |
| UMass Medical School | 1,200 | Healthcare, Biotech |
| Assumption University | 2,200 | Business, Liberal Arts |
| Worcester State | 5,500 | Education, Healthcare, Business |
Total Regional Higher Ed Enrollment: 25,000+
That's a talent pipeline that refills every year, and it's what knowledge-economy employers hire from.
What's being built
Boston Metro:
- 15.5M SF office under construction
- 8,500 multifamily units under construction
- Significant supply concerns in office sector
Central MA:
- 1.2M SF industrial under construction
- 2,200 multifamily units under construction
- Limited new office construction
- Supply/demand more balanced
How the returns actually shook out
Here are the historical returns, 2015-2024.
| Metric | Boston Metro | Central MA |
|---|---|---|
| Average Annual Appreciation | 6.2% | 7.8% |
| Income Yield | 4.8% | 6.5% |
| Total Return | 11.0% | 14.3% |
| Volatility (Std Dev) | 8.5% | 5.2% |
| Sharpe Ratio | 1.29 | 2.75 |
Read the bottom two rows together. Central MA paid more and bounced around less. That's a better risk-adjusted profile, not a marketing line.
How hard it is to get in
Boston:
- Minimum investment for institutional quality: $25-50M
- Competition: Institutional, international, and REIT capital
- Relationships: Established networks dominate deal flow
- Complexity: Extensive due diligence requirements
Central MA:
- Entry points as low as $2-5M
- Competition: Primarily regional and local investors
- Relationships: More accessible broker and owner networks
- Execution: Faster timelines, simpler transactions
Sector by sector
Industrial
| Factor | Boston | Central MA | Winner |
|---|---|---|---|
| Land availability | Very limited | Available | Central MA |
| Clear heights | Mixed vintage | Modern specs available | Central MA |
| Labor costs | Higher | Lower | Central MA |
| Last-mile access | Essential | Excellent | Tie |
| Rent growth | 5-6% | 6-8% | Central MA |
Retail
| Factor | Boston | Central MA | Winner |
|---|---|---|---|
| Foot traffic | Higher density | Car-oriented | Boston |
| Rent stability | Good | Excellent | Central MA |
| Tenant credit | National | Mix of national/regional | Boston |
| Pricing | Premium | Value | Central MA |
Multifamily
| Factor | Boston | Central MA | Winner |
|---|---|---|---|
| Rent levels | $2,800-3,500 | $1,600-2,200 | Tie (relative to costs) |
| Rent growth | 3-4% | 5-7% | Central MA |
| Expense ratio | 45-50% | 38-42% | Central MA |
| Cap rates | 4.0-4.5% | 5.5-6.5% | Central MA |
A deal comparison: two warehouses
Boston Metro Property:
- 100,000 SF distribution warehouse
- Purchase price: $22,000,000 (4.75% cap)
- NOI: $1,045,000
- Rent/SF: $12.50 NNN
Central MA Property (equivalent quality):
- 100,000 SF distribution warehouse
- Purchase price: $15,500,000 (6.75% cap)
- NOI: $1,046,250
- Rent/SF: $12.00 NNN
Comparison:
- Same NOI, $6.5M less capital deployed
- 200 bps higher going-in yield
- Lower tenant costs improve retention
- Greater room for rent growth
What happens if the gap closes
Some investors figure Central MA cap rates will drift toward Boston's as more buyers find the region. If Central MA industrial compresses from 6.75% to 5.75%:
- $1,046,250 NOI / 5.75% = $18,195,652 value
- Starting value: $15,500,000
- Appreciation: 17.4% (plus income collected)
And if the gap never closes, the income differential still compounds over a 10-year hold. You don't need the thesis to pay you to come out ahead.
How I'd start out here
If you're new to the market:
1. Market Tours: Visit Worcester, Marlborough, Framingham, Leominster to understand micro-market differences
2. Broker Relationships: Establish connections with 2-3 active local brokers
3. Property Management: Identify local management resources before acquisition
4. Municipal Relationships: Understand local permitting and economic development priorities
5. Tenant Base: Study existing tenants and demand drivers in target submarkets
""Secondary markets like Worcester consistently outperform primary markets on a risk-adjusted basis. The yield premium over Boston currently exceeds 150 basis points across every property type, while the fundamental drivers, population growth, highway infrastructure, and workforce depth, remain strong," says **Todd Lornell**, Principal & Founder, Lornell Real Estate
Lornell Real Estate specializes in Central Massachusetts commercial real estate investment. We provide market intelligence, deal sourcing, and advisory services to investors seeking superior risk-adjusted returns. Contact us to begin your Central MA investment strategy.
Limitations: Market data, projections, and trend analyses reflect conditions at publication. Commercial real estate markets are inherently cyclical, and submarket and property-level performance can diverge significantly from the regional averages cited. Demographic data, employer information, and regulatory conditions are subject to change. This article does not constitute investment advice. Conduct property-specific due diligence and consult qualified professionals before making investment decisions.
Sources & References
- CoStar
- CoStar Group
- NCREIF
This article cites data from the sources listed above. For the most current figures, consult the original publications directly.
Data current as of publication date. Market conditions, rates, and regulations may have changed. Consult a qualified commercial real estate professional before making investment decisions.
Get the full Central MA market data
Commercial tax-base growth, development activity, and demographics across Central MA, town by town.