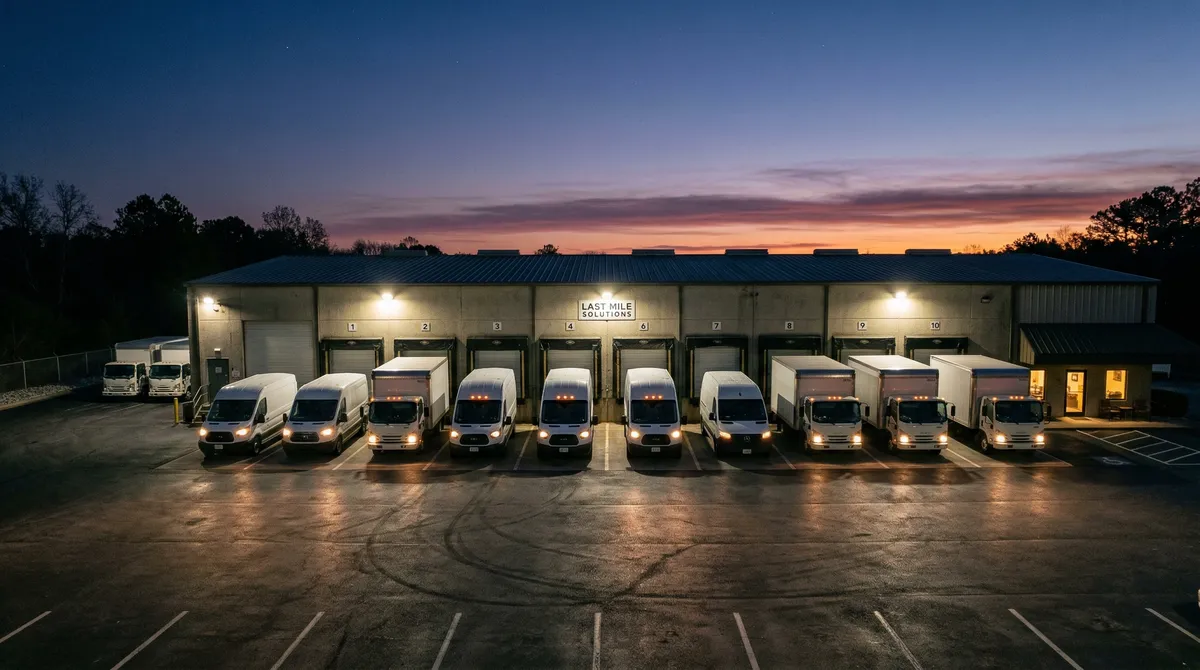
Last-mile delivery facilities are the fastest-growing segment of industrial real estate, with same-day delivery expectations rising from 8% to 23% of orders since 2019, according to Prologis. If you own a smaller industrial building (20,000-150,000 SF) in an urban or suburban spot near a Central Massachusetts population center, that shift is pushing demand your way, plus rent premiums of 20-40% above traditional industrial rates.
Demand is up: Same-day delivery expectations went from 8% to 23% of orders since 2019, and that pulls demand toward last-mile facilities.
The building that fits: Owners of industrial buildings in the 20,000-150,000 SF range in urban and suburban locations are the ones best set up to benefit.
The rent premium: Last-mile facilities run 20-40% higher rents than traditional industrial space, because the location is what carries the value.
Location beats condition: Operators care more about how close a building sits to consumers than about its age or clear height, so older Class B buildings with good access are in demand.
The Central MA angle: A building here can reach 4.5 million people inside a 30-mile radius, covering the Boston, Worcester, and Providence metros.
Last-mile delivery is the final stage of a package's trip, from a distribution hub to the customer's door. It's what determines how fast the package shows up, which is what e-commerce customers judge you on.
Same-day delivery surge: From 8% to 23% of all e-commerce orders since 2019, which means facilities have to sit within 20-30 miles of consumers (Prologis)
Facility size: 20,000-150,000 SF, so older Class B buildings in suburban spots are suddenly wanted (CBRE)
Rent premium: Last-mile facilities run 20-40% over traditional industrial space, on the strength of location (Prologis)
Population reach: Central MA facilities reach 4.5 million people within a 30-mile radius, covering the Boston, Worcester, and Providence metros (U.S. Census Bureau)
The last-mile revolution
Last-mile delivery is the final leg of a package's trip, from the distribution facility to the customer's door.
Why last-mile matters
Here's what consumers now expect:
| Delivery Speed | 2019 | 2025 |
|---|---|---|
| Same-day | 8% | 23% |
| Next-day | 28% | 45% |
| 2-3 day | 52% | 28% |
To deliver same-day or next-day, a facility has to sit within 20-30 miles of consumers.
What a last-mile building looks like
| Feature | Last-Mile | Traditional |
|---|---|---|
| Size | 20,000-150,000 SF | 200,000-1,000,000+ SF |
| Clear height | 24-32 feet | 32-40 feet |
| Dock doors | 1 per 3,000-5,000 SF | 1 per 7,500-10,000 SF |
| Car parking | 3-5 per 1,000 SF | 0.5-1 per 1,000 SF |
| Location | Urban/suburban | Rural/highway |
Why location beats building quality
Operators will take an older building, a lower clear height, and a layout that isn't perfect, as long as the location lets them deliver fast.
Who the tenants are
Amazon delivery stations: 80,000-150,000 SF, 10-15 year leases, investment grade
Parcel carriers (FedEx, UPS, DHL): building out small-format networks
3PL last-mile: serving several e-commerce clients at once
Grocery and food delivery: dark stores and micro-fulfillment, 10,000-40,000 SF
The Central Massachusetts opportunity
The geography works
From Central MA, an operator can cover:
- Greater Boston (to the east)
- Worcester metro (local)
- Providence (to the south)
- Hartford (to the southwest)
| Radius | Population | Drive Time |
|---|---|---|
| 15 miles | 1.2 million | 30 min |
| 30 miles | 4.5 million | 60 min |
The inventory is already here
Plenty of Central MA buildings hit the last-mile marks:
- 1970s-1990s construction
- 20,000-80,000 SF
- 20-28 foot clear height
- Good highway access
These are the "Class B" buildings, and they're wanted now.
What this means if you own the building
What it does to your rent
Before last-mile demand, an older building rented at $5-7/SF NNN. With the last-mile premium, a well-located building rents at $8-12/SF NNN.
What that does to value
| Metric | Before | After |
|---|---|---|
| Rent/SF | $6.00 | $10.00 |
| 50,000 SF rent | $300,000 | $500,000 |
| Cap rate | 7.5% | 6.5% |
| Value | $4.0M | $7.7M |
| Value increase | +$3.7M |
The improvements worth making
- Add dock doors
- Add parking for vans and cars
- Fix truck circulation
- Handle the basic cosmetics
- Put in LED lighting
Lornell Real Estate works in industrial properties across Central Massachusetts. Get in touch to talk through an investment or how to position a building.
Limitations: Market data, projections, and trend analyses reflect conditions at publication. Commercial real estate markets are inherently cyclical, and submarket and property-level performance can diverge significantly from the regional averages cited. Demographic data, employer information, and regulatory conditions are subject to change. This article does not constitute investment advice. Conduct property-specific due diligence and consult qualified professionals before making investment decisions.
Sources & References
- CBRE
- Census Bureau
- Prologis
- U.S. Census Bureau
This article cites data from the sources listed above. For the most current figures, consult the original publications directly.
Data current as of publication date. Market conditions, rates, and regulations may have changed. Consult a qualified commercial real estate professional before making investment decisions.
Get the full Central MA market data
Commercial tax-base growth, development activity, and demographics across Central MA, town by town.