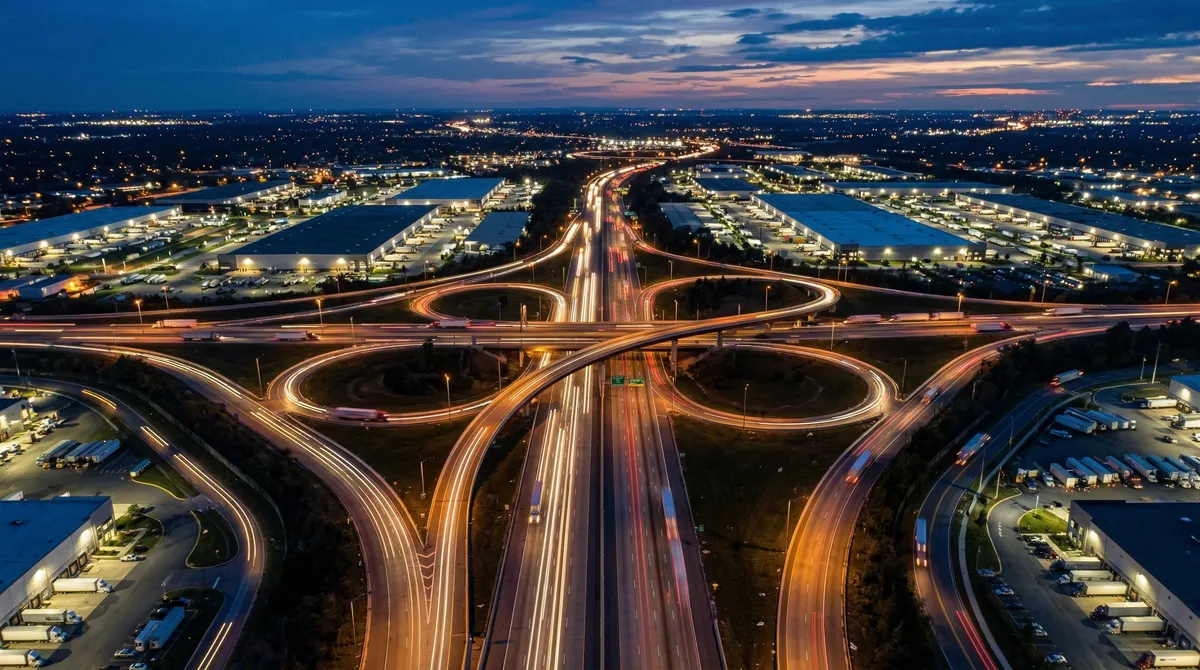
I've watched Central Massachusetts turn into the next e-commerce distribution hub in the Northeast, and the reasons aren't complicated: the highway network, 16% lower labor costs, and industrial rents 40-50% below Boston Metro. Prologis pegs it at roughly 1.25 million square feet of warehouse space for every $1 billion in e-commerce sales, and with U.S. online sales projected to reach $1.8 trillion by 2030 (Statista), Central MA is going to pull outsized demand.
E-commerce real estate demand: Every $1 billion in online sales requires approximately 1.25 million square feet of warehouse space (Prologis).
Labor savings: Central Massachusetts offers 16% lower labor costs, potentially saving $910,000 annually for a 100-employee facility versus Boston Metro.
Rent advantage: Worcester industrial rents are 40-50% below Boston Metro, ranging $8-11/SF compared to $18-22/SF in Boston/Cambridge.
Vacancy tightening: Central MA industrial vacancy is projected to drop from 6.8% in 2022 to a tight 3.8% in 2025, indicating strong demand.
Last-mile economics is the analysis of costs and efficiencies involved in the final leg of the supply chain, moving goods from a transportation hub or distribution center to the end customer's delivery address.
E-commerce real estate demand: Every $1B in online sales requires 1.25M SF of warehouse space (Prologis)
Labor savings: $910,000 annually for a 100-employee facility vs. Boston Metro (Bureau of Labor Statistics)
Rent advantage: Worcester industrial rents at $8-11/SF vs. $18-22/SF in Boston/Cambridge (CoStar Group)
Vacancy tightening: Central MA industrial vacancy has dropped from 6.8% in 2022 to 3.8% in 2025 (CoStar Group)
The e-commerce logistics imperative
E-commerce changed what industrial real estate is for. It used to be about storing goods. Now it's about moving them faster, cheaper, and closer to the people buying them.
The numbers
Here's the e-commerce growth curve. Online sales ran $762 billion in 2020, are projected at $1.2 trillion for 2025, and $1.8 trillion for 2030.
On the real estate side, every $1 billion in e-commerce sales requires 1.25 million SF of warehouse space. E-commerce eats 3x the warehouse space of traditional retail per sales dollar, and returns processing tacks on another 15-20%.
Why location has never mattered more
Consumer expectations have reset, and the delivery-speed data shows exactly how fast.
| Delivery Speed | 2019 | 2025 |
|---|---|---|
| Same-day | 8% of orders | 23% of orders |
| Next-day | 28% | 45% |
| 2-3 days | 52% | 28% |
| 4+ days | 12% | 4% |
You can't hit those numbers without distribution networks sitting closer to consumers. The old hub-and-spoke model is turning into distributed nodes.
Central Massachusetts: the strategic advantage
Geographic position
Central Massachusetts sits where the major transportation arteries cross:
Interstate Highway Network:
- I-90 (Mass Turnpike): East-West corridor connecting Boston (40 mi) to Albany (90 mi) and beyond
- I-290: Worcester bypass connecting to I-90 and I-495
- I-190: North-South route to Leominster and Route 2
- I-395: South to Connecticut and I-95
And here's who you can reach from here:
| Radius | Population | Major Markets |
|---|---|---|
| 30 miles | 2.8 million | Worcester, Framingham, Marlborough |
| 60 miles | 8.5 million | Boston, Providence, Hartford |
| 120 miles | 25 million | Add NYC, Southern NH, Maine |
Last-mile economics
Look at what the last mile actually costs by origin:
| Origin | Delivery Zone | Avg Cost/Package |
|---|---|---|
| Boston urban warehouse | Greater Boston | $8.50 |
| Worcester distribution | Greater Boston | $6.25 |
| Worcester distribution | Central MA | $4.75 |
| Worcester distribution | Providence/Hartford | $7.50 |
My read: a distribution center in Central MA can serve the whole Greater Boston market for less than a Boston-based facility, and reach Providence and Hartford efficiently on top of it.
Labor economics
Now the labor side, side by side:
| Metric | Boston Metro | Central MA | Advantage |
|---|---|---|---|
| Average hourly wage | $21.50 | $18.00 | 16% savings |
| Entry-level rate | $17.00 | $15.50 | 9% savings |
| Worker availability | Tight | Moderate | Central MA |
| Turnover rate | 45% | 32% | Central MA |
| Commute time | 35 min | 22 min | Central MA |
For a 100-employee facility, the wage differential runs about $730,000/year and reduced turnover cost adds roughly $180,000/year, for about $910,000/year total. For a lot of operators, that number alone settles the location question.
Real estate costs
Then there's rent:
| Location | Asking Rent (NNN) | Annual Cost (100K SF) |
|---|---|---|
| Boston/Cambridge | $18-22/SF | $1.8-2.2M |
| Route 128 | $14-17/SF | $1.4-1.7M |
| I-495 Belt | $11-14/SF | $1.1-1.4M |
| Worcester | $8-11/SF | $800K-1.1M |
| Leominster | $7-9/SF | $700K-900K |
A 200,000 SF facility in Central MA saves $1.0-1.5M a year against Route 128.
The demand pipeline
Who's leasing industrial space
The e-commerce and logistics tenants driving Central MA demand fall into a few buckets.
Category 1: Third-Party Logistics (3PL)
- XPO Logistics
- Ryder
- DHL Supply Chain
- Regional 3PLs
Category 2: Direct-to-Consumer Brands
- Consumer goods companies
- Health and beauty brands
- Apparel companies
- Subscription services
Category 3: Grocery and Food
- Online grocery services
- Meal kit companies
- Cold storage operators
- Food distributors
Category 4: Returns Processing
- Reverse logistics specialists
- Refurbishment operations
- Resale platforms
Recent transaction activity
Here's what's actually traded in Central MA industrial in 2024-2025:
| Tenant | Location | Size | Use |
|---|---|---|---|
| Amazon | Northborough | 650,000 SF | Distribution |
| National retailer | Worcester | 425,000 SF | E-commerce fulfillment |
| 3PL operator | Leominster | 280,000 SF | Multi-client logistics |
| Food distributor | Shrewsbury | 175,000 SF | Cold storage |
| Consumer goods co. | Westborough | 150,000 SF | Regional distribution |
Absorption trends
Net absorption in Central MA industrial ran 1.8 million SF in 2023 and 2.2 million SF in 2024. It's at 1.6 million SF year-to-date for 2025, with 2.5 million SF projected for the full year.
Vacancy has come down every year: 6.8% in 2022, 5.2% in 2023, 4.5% in 2024, and 3.8% in 2025.
Building specifications for e-commerce
Modern e-commerce facilities need specific features, and they're a step up from what a traditional warehouse gets away with.
Minimum requirements
| Specification | E-Commerce Standard | Traditional Warehouse |
|---|---|---|
| Clear height | 32-40 feet | 24-28 feet |
| Floor load | 300+ PSF | 150 PSF |
| Column spacing | 50' × 50' minimum | 40' × 40' |
| Dock doors | 1 per 7,500 SF | 1 per 10,000 SF |
| Trailer parking | 1 per 5,000 SF | 1 per 10,000 SF |
| Car parking | 3 per 1,000 SF | 1 per 1,000 SF |
| Power | 2,500+ amps | 1,200 amps |
Technology infrastructure
Modern logistics also needs:
- Fiber optic connectivity (redundant)
- Warehouse management system integration
- RFID/barcode scanning throughout
- Climate control for sensitive goods
- Security systems with access control
- EV charging for delivery fleet
Sustainability features
And more and more, the major tenants require:
- LEED or equivalent certification
- Solar-ready rooftops
- LED lighting throughout
- Smart building systems
- Stormwater management
- EV infrastructure
Investment opportunities
New development
On build-to-suit, a pre-leased development takes lease-up risk off the table. Tenants often sign 10-15 year terms, developers earn premium returns, and the sale pricing at stabilization is strong.
Spec development is a different animal. Smaller projects in the 100,000-250,000 SF range, divisible floor plans, targeting an 18-month lease-up. Higher risk, but the returns can be higher too.
Value-add acquisition
There's room in the existing stock as well.
On repositioning plays, you increase clear heights where the building allows it, add dock doors, improve truck court circulation, upgrade electrical, and modernize fire suppression.
On rent growth, you're looking for below-market leases rolling to expiration, tenant expansion opportunities, and accessory uses like office or mezzanine.
Forward commitment
You can also work directly with developers: commit capital at project inception, negotiate terms during construction, and acquire at stabilization. That gets you a lower basis than buying in the open market.
Market forecast: 2026-2030
Demand drivers
Pushing demand up: e-commerce penetration still rising, the inventory restocking cycle, nearshoring of manufacturing, and data center-adjacent demand.
Working against it: some overbuilding in select markets, a possible economic slowdown, and efficiency improvements that trim how much space operators need.
Central MA outlook
On rent, I'd look for 4-6% growth in 2026, 3-5% across 2027-2028, and 2-4% in 2029-2030.
On vacancy, 3.5-4.0% in 2026, then 4.0-5.0% through 2027-2030 as new supply gets absorbed.
Cap rates sit at 6.5-7.0% today and I expect them to compress toward 6.0-6.5% by 2028 as the market matures.
Lornell Real Estate is actively sourcing industrial investment opportunities across Central Massachusetts. Contact us to discuss acquisition targets, development sites, or strategic portfolio positioning.
Limitations: Market data, projections, and trend analyses reflect conditions at publication. Commercial real estate markets are inherently cyclical, and submarket and property-level performance can diverge significantly from the regional averages cited. Demographic data, employer information, and regulatory conditions are subject to change. This article does not constitute investment advice. Conduct property-specific due diligence and consult qualified professionals before making investment decisions.
Sources & References
- Bureau of Labor Statistics
- CoStar
- CoStar Group
- Prologis
- Statista
This article cites data from the sources listed above. For the most current figures, consult the original publications directly.
Data current as of publication date. Market conditions, rates, and regulations may have changed. Consult a qualified commercial real estate professional before making investment decisions.
Get the full Central MA market data
Commercial tax-base growth, development activity, and demographics across Central MA, town by town.