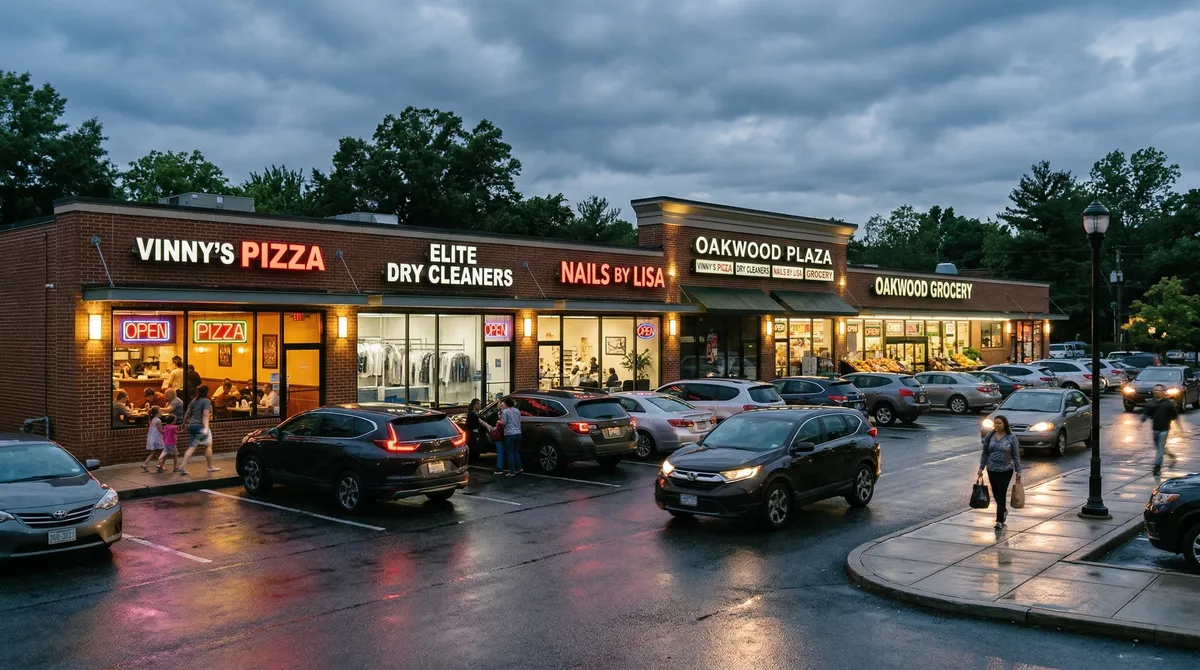
Neighborhood shopping centers didn't get the memo about the "retail apocalypse." They're sitting at their lowest vacancy rates in 20 years. CoStar Group puts national neighborhood retail vacancy at 5.2%, the lowest since 2004, and asking rents are up 18% from 2021. The tenants driving that are the ones e-commerce can't touch: necessity uses and services.
Market Strength: National neighborhood retail vacancy stands at a 20-year low of 5.2%, with asking rents climbing 18% since 2021.
Scarcity Value: New construction of neighborhood retail centers is at a 30-year low, contributing to asset scarcity and bolstering the value of existing properties.
Strategic Advantage: Grocery-anchored centers demonstrate superior performance, achieving 94% inline occupancy versus 87% for non-anchored counterparts.
Tenant Evolution: Successful neighborhood centers pivot towards necessity-based and service-oriented tenants, including food, medical, and fitness, rather than traditional retail categories.
Neighborhood centers are convenience-focused retail properties, typically 15,000-100,000 SF, that serve local residents with necessity-based tenants and service-oriented uses.
Neighborhood retail vacancy: 5.2%, the lowest since 2004 (CoStar Group)
Rent growth: Asking rents up 18% from 2021 levels across neighborhood centers (CoStar Group)
New construction: At 30-year lows, creating scarcity value for existing inventory (CBRE)
Grocery-anchored premium: Centers with grocery anchors achieve 94% inline occupancy vs. 87% without (ICSC)
What the headlines missed
For years the coverage on retail real estate was grim. Amazon was going to kill physical stores. The pandemic was supposed to finish the job. It's 2026, and neighborhood retail is doing better than it has in two decades.
Read the numbers
The national numbers:
- Current vacancy: 5.2% (lowest since 2004)
- Asking rents: Up 18% from 2021
- Net absorption: Positive for 14 consecutive quarters
- New construction: At 30-year lows
The so-called apocalypse was a cleanup, not a collapse. Weak concepts failed, overleveraged operators closed, the B and C locations emptied out. What's left is a leaner set of centers that actually work.
Why neighborhood centers held up
Not all retail is the same, and the format matters more than most people think:
| Format | Current Vacancy | 5-Year Trend |
|---|---|---|
| Regional malls | 12.5% | Declining |
| Power centers | 8.2% | Stable |
| Neighborhood centers | 5.2% | Improving |
| Strip retail | 4.8% | Improving |
What holds them up:
- Necessity-Based Tenants: Grocery, pharmacy, medical, fitness
- Service-Oriented Uses: Restaurants, salons, repair services
- Convenience Location: Within 5 minutes of residential
- Right-Sized Footprints: 15,000-100,000 SF total GLA
- Lower Rents: Affordable for local and regional operators
How the tenant mix changed
Yesterday's retail center vs. today's:
| 2015 Tenant Mix | 2025 Tenant Mix |
|---|---|
| Apparel (25%) | Food & Beverage (28%) |
| Electronics (12%) | Medical/Dental (15%) |
| Sporting Goods (10%) | Fitness/Wellness (12%) |
| Banks (8%) | Service Retail (18%) |
| Other (45%) | Grocery (15%), Other (12%) |
"The modern neighborhood center is less about shopping and more about services, experiences, and daily needs.
The essential retail thesis
Categories that hold up
Grocery-Anchored Centers
A grocery anchor gives you:
- Consistent traffic (2-3 visits/week per household)
- Extended hours generating evening and weekend activity
- Predictable rent from credit tenants
- Co-tenancy that supports inline tenants
Performance metrics:
| Metric | With Grocery Anchor | Without Grocery |
|---|---|---|
| Inline occupancy | 94% | 87% |
| Rent premium | +15-20% | Baseline |
| Traffic count | 3.5x higher | Baseline |
Medical Retail
Healthcare keeps moving into retail space:
- Urgent care clinics
- Physical therapy
- Dental practices
- Vision centers
- Diagnostic labs
- Mental health services
Why retail?: Convenient access, lower costs than medical office buildings, evening and weekend hours.
Fitness and Wellness
Fitness looks different since the pandemic:
- Boutique concepts (yoga, cycling, HIIT)
- Recovery services (cryotherapy, massage)
- Personal training studios
- Wellness spas
Fitness tenants typically sign 7-10 year leases with annual increases.
Quick Service Restaurants
QSR demand keeps holding:
- Drive-thru prototypes
- Fast-casual concepts
- Coffee shops
- Juice bars
QSR tenants will often pay premium rents for an end-cap or a drive-thru spot.
Trade area analysis
What makes a strong trade area
For neighborhood retail, here's what I look at:
Demographics:
- Population within 3 miles: 25,000+ preferred
- Median household income: $60,000+ for general retail
- Household growth: Positive trends
- Age distribution appropriate to tenant mix
Traffic and Access:
- Daily traffic counts: 20,000+ vehicles
- Visibility from major road
- Easy ingress/egress
- Adequate parking (5 spaces per 1,000 SF)
Competition:
- Identify competitive centers within 3 miles
- Evaluate void analysis (underserved categories)
- Assess new development pipeline
- Understand tenant overlap
Central MA trade areas
Trade areas I'd point to in Central Massachusetts:
Worcester - Lincoln Street:
- 45,000 population (3 mi)
- $72,000 median HHI
- Strong traffic (28,000 ADT)
- Mixed-use redevelopment driving growth
Shrewsbury - Route 9:
- 38,000 population (3 mi)
- $105,000 median HHI
- Premium demographics
- Limited new development
Marlborough - Route 20:
- 42,000 population (3 mi)
- $95,000 median HHI
- Corporate employment base
- Growing residential development
Investment considerations
How I underwrite these centers
The metrics I watch for neighborhood retail:
Rent Roll Analysis:
| Factor | Target |
|---|---|
| Anchor rent | $12-18/SF (depends on size) |
| Inline rent | $22-35/SF |
| Occupancy | 92%+ |
| Weighted average lease term | 4+ years |
| In-place rent vs. market | Within 10% |
Tenant Quality Assessment:
- National credit anchors preferred
- Regional tenants with multiple locations
- Local operators with strong track records
- Avoid excessive concentration
Lease Structure:
Lease terms I want to see:
- NNN (tenant pays taxes, insurance, CAM)
- Annual rent increases (2-3%)
- Co-tenancy provisions reviewed carefully
- Recapture rights for anchor spaces
Where the upside is
1. Below-Market Rents
- Legacy tenants with flat rents
- Spaces not re-leased since 2015-2019
- Push to market on renewal or turnover
2. Occupancy Improvement
- Vacant inline spaces
- Outparcel development opportunity
- Mezzanine or subdivision potential
3. Expense Reduction
- CAM reconciliation improvement
- Utility cost reduction (LED, solar)
- Property tax appeals
4. Tenant Mix Enhancement
- Replace low-rent local tenants with national concepts
- Add complementary uses
- Improve food and beverage offerings
Where deals go wrong
What I steer clients away from
1. Anchor Exposure
- Don't buy centers dependent on single anchor
- Watch for anchor lease expirations
- Understand co-tenancy clauses
2. Deferred Maintenance
- Parking lot condition
- HVAC systems age
- Roof remaining life
- ADA compliance
3. Traffic Declines
- Bypassed by new roads
- Competitive development
- Residential population shifts
4. Format Obsolescence
- Inadequate parking ratios
- Poor visibility
- Difficult access
- Wrong tenant sizes
The 2026 opportunity
Why now
A few things line up in favor of retail right now:
1. Pricing Disconnect
- Cap rates 100-150 bps above office/industrial
- Investor sentiment still recovering from "apocalypse" narrative
- Strong fundamentals not reflected in pricing
2. Limited New Supply
- Construction costs prohibit most new development
- Existing inventory gaining scarcity value
- Barriers to entry rising
3. Tenant Demand
- Retailers expanding again
- Service tenants growing
- Medical migration to retail
4. Operational Stability
- Long-term leases (5-10 years)
- NNN structures reduce expense volatility
- Credit tenant anchors
Target profile
The neighborhood center I'd want to buy:
| Attribute | Target |
|---|---|
| Size | 40,000-100,000 SF |
| Anchor | Grocery or strong national credit |
| Occupancy | 88-95% (some value-add) |
| Inline rent | $20-30/SF NNN |
| Cap rate | 7.0-8.0% |
| WALT | 4-6 years |
| Location | Strong demographics, traffic |
Lornell Real Estate is actively seeking neighborhood retail investment opportunities across Central Massachusetts. Contact us to discuss specific targets or off-market opportunities.
Limitations: Market data, projections, and trend analyses reflect conditions at publication. Commercial real estate markets are inherently cyclical, and submarket and property-level performance can diverge significantly from the regional averages cited. Demographic data, employer information, and regulatory conditions are subject to change. This article does not constitute investment advice. Conduct property-specific due diligence and consult qualified professionals before making investment decisions.
Sources & References
- CBRE
- CoStar
- CoStar Group
- ICSC
This article cites data from the sources listed above. For the most current figures, consult the original publications directly.
Data current as of publication date. Market conditions, rates, and regulations may have changed. Consult a qualified commercial real estate professional before making investment decisions.
Get the full Central MA market data
Commercial tax-base growth, development activity, and demographics across Central MA, town by town.