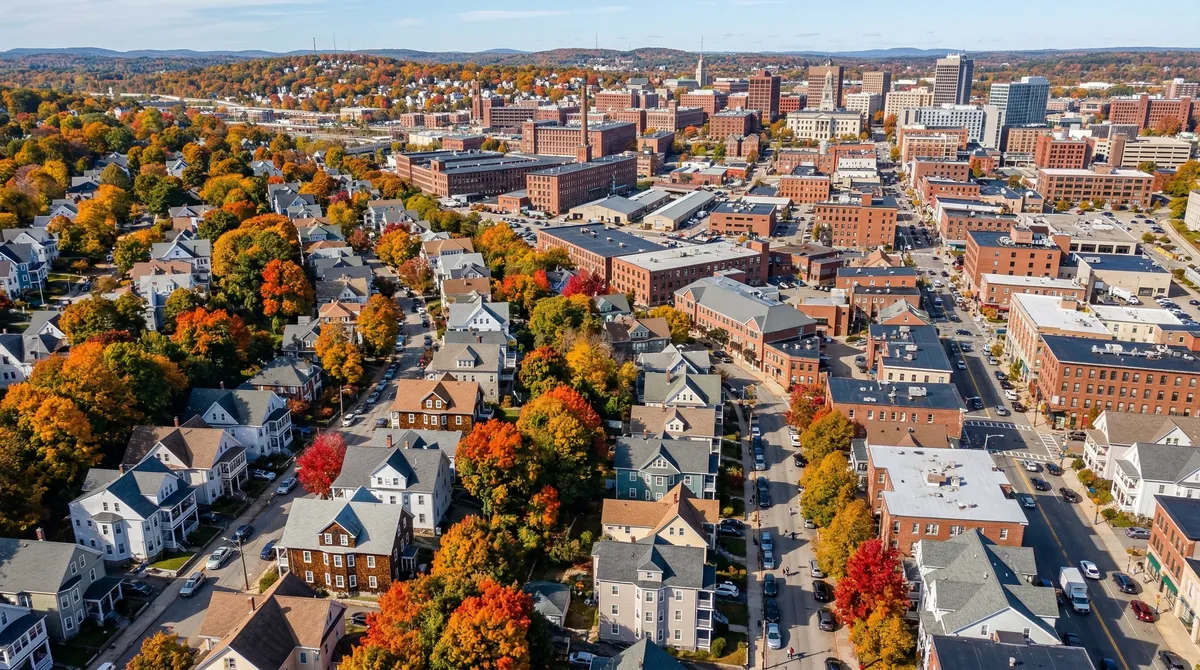
Realtor.com ranked Worcester the #3 housing market in the country for 2026, projecting 12.6% home sale growth and 2.4% price appreciation. I've spent 35 years brokering deals in Central Mass, and here's how I read that residential number: it feeds straight into demand for retail, industrial, and medical office space. Every 1,000 new residents generates roughly 15,000-20,000 SF of neighborhood retail demand, per ICSC (International Council of Shopping Centers).
Market Outlook: Worcester is ranked #3 nationally for 2026, projecting a combined 15% growth in home sales and price appreciation.
Affordability Driver: Worcester's median home price of $450,000 is 40% lower than Greater Boston, attracting new residents.
Tight Inventory: The market has just 1.8 months of housing supply, leading to homes selling in 24 days with an average of three offers.
Commercial Impact: Every 1,000 new residents generates 15,000-20,000 square feet of neighborhood retail demand.
Population Growth: Worcester experienced 14.1% population growth from 2010-2020, becoming New England's fastest-growing city over 100,000 residents.
Months of Supply is a real estate metric indicating how long it would take for all current homes on the market to sell at the current sales pace, assuming no new inventory is added.
National ranking: #3 housing market for 2026 with a combined 15% growth figure across sales volume and price (Realtor.com)
Affordability driver: Worcester median home price ~$450,000, roughly 40% below Greater Boston's median (Realtor.com)
Housing inventory: Just 1.8 months of supply with homes receiving 3 offers and selling in 24 days (Realtor.com)
Commercial demand multiplier: Every 1,000 new residents creates 15,000-20,000 SF of retail demand (ICSC)
The ranking, and why it matters to a commercial broker
Realtor.com's 2026 housing market forecast put Worcester #3 nationally for projected growth. Only two metros in the whole country ranked higher. The numbers behind it: 12.6% projected home sale growth and 2.4% price appreciation, which comes to a combined 15% growth figure across sales volume and median sale price. Worcester County is projected to see the third-highest rate of existing home sales in the nation.
This didn't come out of nowhere. Worcester has been building toward this for years. But if you're an investor or operator on the commercial side, the residential headline is where the story starts, not where it ends. Every housing sale, every new resident, every household trading Boston's $750,000-plus market for Worcester's $450,000 median creates downstream demand for retail space, warehouse capacity, medical offices, and services.
What's driving the residential surge
Affordability migration
The main driver is price. Worcester's median home price sits around $450,000, up 4.7% year-over-year. That's roughly 40% below Greater Boston's median. Remote and hybrid work isn't a phase anymore, it's structural, and Worcester lets someone on a Boston income buy an actual house. The commuter rail runs straight to Back Bay and South Station, so Worcester works as a daily commute for people who only need to be in the city two or three days a week.
Supply and demand fundamentals
The market is tight. Worcester homes get an average of 3 offers and sell in about 24 days. Inventory sits at just 1.8 months of supply, well under the 6-month line that marks a balanced market. Roughly 1,600 new housing units are under construction across the city, but at this pace of demand that pipeline barely dents the shortage.
Population growth
Worcester's population grew 14.1% between 2010 and 2020, the fastest of any New England city over 100,000 residents. The current count is around 206,000. That growth rate beat Boston, Providence, Hartford, and every other major New England metro.
State investment
Governor Healey announced over $161 million in state economic development grants aimed at Worcester County. Add Polar Park's pull on the Canal District and the restaurant and entertainment scene growing on Shrewsbury Street, and you have public capital and private momentum landing at the same time.
The direct connection: residential growth drives commercial demand
This is where it turns from a residential headline into a commercial opportunity. Population growth and housing sales aren't just residential numbers. They're leading indicators for commercial demand across every property type.
Retail: more residents, more storefronts
The retail math is simple. Industry benchmarks say every 1,000 new residents creates demand for roughly 15,000 to 20,000 SF of retail space: grocery, restaurants, services, medical, fitness, personal care. Worcester is adding thousands of households, and each one is a customer for local retailers.
Current conditions back this up:
| Metric | Worcester Retail Market |
|---|---|
| Available listings | ~81 |
| Average rent | $20-22/SF |
| Vacancy trend | At or near 20-year lows statewide |
| Fastest-moving segment | Small-format retail under 3,000 SF |
The affordability migration also shifts the spending profile. Households coming from Boston bring higher incomes into the Worcester market, which lifts average spending power and supports better retail tenants: specialty food, fitness concepts, urgent care, fast-casual restaurants.
The restaurant and entertainment scene around Polar Park and Shrewsbury Street is already proof of it. Those tenants didn't show up by accident. They followed the population.
Industrial: the construction supply chain effect
Those 1,600 housing units under construction need building materials, staging areas, contractor shops, and equipment storage. That construction drives industrial demand two ways.
Direct demand: Contractors, subcontractors, and building material suppliers need warehouse and flex space. Small industrial under 6,000 SF is already moving fast in Worcester, with average industrial rents around $10/SF across 41 active listings.
Logistics demand: A bigger population needs more last-mile delivery infrastructure. Every Amazon package, grocery delivery, and medical supply shipment needs distribution space closer to the customer. As Worcester adds residents, it becomes a stronger node for regional distribution networks anchored by I-90, I-290, and I-190.
Office and medical office: services follow people
Population growth drives demand for professional services, and those services need space. Medical offices, dental practices, physical therapy, legal services, financial advisors, insurance agencies, they all scale with population.
UMass Memorial Health, the region's largest employer, keeps expanding its outpatient and specialty clinic footprint. As Worcester adds residents, demand for medical office space away from the main hospital campus grows right along with it. Suburban medical office along the major corridors, Route 9, Route 20, Route 12, is a particularly strong opportunity for landlords and investors.
Multifamily and mixed-use: the feedback loop
The housing shortage that produced the #3 ranking also creates multifamily investment opportunities. With only 1.8 months of supply and homes drawing multiple offers within days, rental demand stays intense. Mixed-use development, ground-floor retail with residential above, captures both sides of the growth.
Transit-oriented development near the commuter rail station and along bus rapid transit routes offers the highest density potential. The Canal District, already reshaped by Polar Park, has the zoning and infrastructure to absorb serious mixed-use development over the next five years.
Which corridors benefit most
Not every submarket wins equally. Here are the corridors positioned to capture the most commercial demand from Worcester's residential growth.
Downtown Worcester and Canal District: Ground-floor retail and restaurant space serving a growing residential population. Rents trending $22-28/SF for prime locations.
Shrewsbury Street: Already the city's dining and nightlife corridor, and it's feeding off Polar Park foot traffic and Canal District residential density.
Route 9 Corridor (Auburn through Spencer): The main east-west commercial artery, carrying roughly 16,000 ADT through Spencer and higher counts near Auburn. Retail rents run from $12/SF NNN in Spencer to $20+/SF closer to Worcester, so there are entry points across the risk spectrum.
I-290 / I-190 Industrial Corridors: Warehouse and flex space serving distribution, contractors, and light manufacturing. Small-bay industrial under 6,000 SF is the tightest segment.
Route 20 (Auburn/Oxford): Secondary retail and flex corridor benefiting from I-90 access and suburban residential growth in southern Worcester County.
How I'd respond as a CRE investor
The Realtor.com ranking confirms what those of us working the ground already see: Worcester is absorbing people, capital, and economic activity fast enough to demand new commercial space. Here's how I'd act on it.
Retail investors: Target anchored neighborhood centers and strip retail in growing residential corridors. Triple Net leased retail with necessity tenants (grocery, pharmacy, medical, dollar stores) gives you stable cash flow with built-in demand growth. With retail vacancy at 20-year lows statewide, landlords hold the pricing power.
Industrial investors: Buy small-bay industrial and flex near highway interchanges. Construction-driven demand plus last-mile logistics growth is squeezing vacancy in this segment. Properties with clear heights above 16 feet and drive-in door access command premium rents.
Value-add operators: Worcester's tight housing market makes multifamily value-add plays compelling. Renovate, re-tenant, and benefit from both rent growth and cap rate compression as the market matures.
Developers: Mixed-use projects near transit and in the Canal District corridor capture the density Worcester's growth demands. The $161 million in state grants creates a public-private capital stack that pencils on projects that wouldn't have worked three years ago.
The bottom line
Worcester's #3 national ranking is a residential headline, but the commercial side is the real story. More residents mean more retail customers, more patients for medical offices, more packages needing warehouse space, and more demand for every category of commercial real estate. The data, 14.1% population growth, a median home price 40% below Boston, 1.8 months of housing supply, $161 million in state investment, points to sustained growth, not a speculative spike.
For CRE investors, the question isn't whether Worcester's growth will drive commercial demand. It already is. The question is whether you put capital in ahead of the curve or chase it afterward.
Lornell Real Estate advises investors, landlords, and tenants across Worcester County and Central Massachusetts. Contact our team at (860) 305-7432 to discuss opportunities in this market.
Limitations: Market data, projections, and trend analyses reflect conditions at publication. Commercial real estate markets are inherently cyclical, and submarket and property-level performance can diverge significantly from the regional averages cited. Demographic data, employer information, and regulatory conditions are subject to change. This article does not constitute investment advice. Conduct property-specific due diligence and consult qualified professionals before making investment decisions.
Sources & References
- ICSC
- International Council of Shopping Centers
This article cites data from the sources listed above. For the most current figures, consult the original publications directly.
Data current as of publication date. Market conditions, rates, and regulations may have changed. Consult a qualified commercial real estate professional before making investment decisions.
Get the full Central MA market data
Commercial tax-base growth, development activity, and demographics across Central MA, town by town.