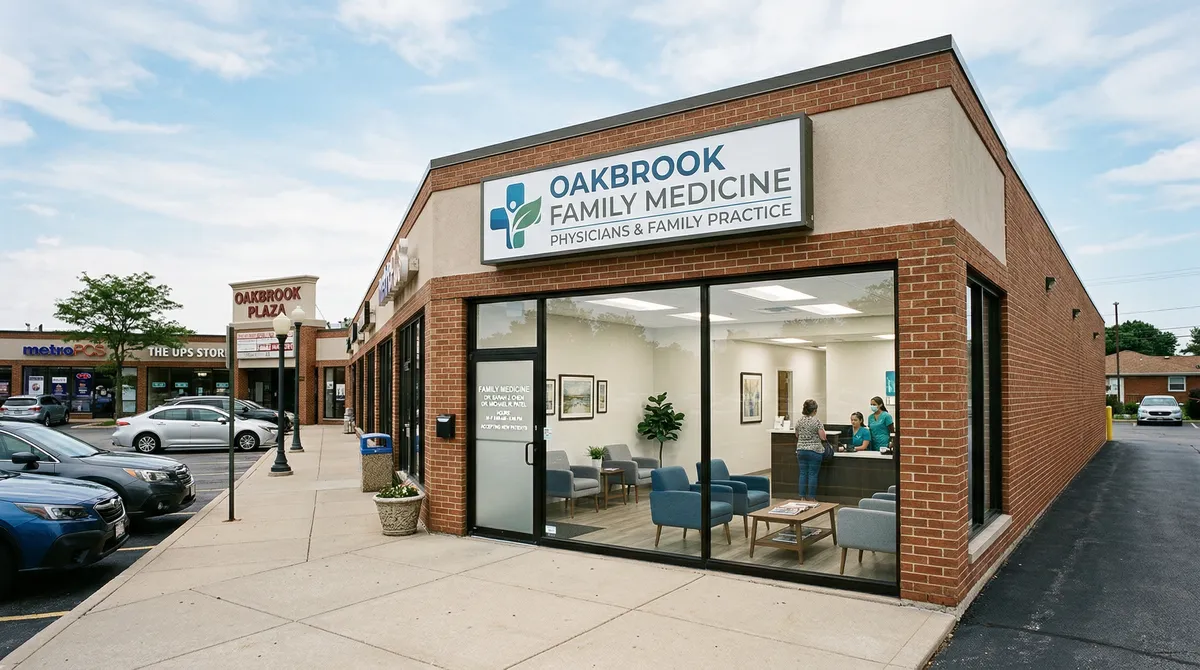
Medical office buildings are about as recession-resistant as commercial real estate gets. Average vacancy runs 8.2%, versus 17.2% for traditional office, according to CBRE. The U.S. medical office market is north of $150 billion and growing 3-4% a year as providers move off hospital campuses and into retail-style space where occupancy costs run 30-45% lower.
Medical office buildings hold an 8.2% average vacancy, well under traditional office at 17.2%, which tells you the demand is stable.
The $150+ billion U.S. medical office market is growing 3-4% a year, driven by providers chasing 30-45% lower occupancy costs in retail locations.
Tenants stick: 85% retention and 7-10 year leases, versus 65% retention and 5-7 year terms for traditional office.
Providers save 30-45% on rent and 25-40% on build-out by leaving hospital campuses for convenient retail-style space.
NNN (Triple Net Lease) is a commercial lease agreement where the tenant pays not only rent but also all property expenses, including real estate taxes, building insurance, and maintenance costs.
Medical office vacancy: 8.2% vs. 17.2% for traditional office (CBRE)
Tenant retention: 85% for medical tenants vs. 65% for traditional office, reducing turnover costs (Cushman & Wakefield)
Market growth: $150+ billion U.S. medical office market growing at 3-4% annually (Statista)
Cost savings for providers: Retail locations offer 30-45% lower rent and 25-40% lower build-out costs vs. hospital campuses (CBRE)
Healthcare is leaving the hospital
Healthcare is leaving the hospital. Patients want convenience, insurers keep squeezing on cost, and outpatient care can now handle procedures that used to require a hospital. Put those together and the services move to retail-style locations closer to where people live.
The numbers
Here is the size of the market and where it is headed:
- U.S. medical office market: $150+ billion
- Annual demand growth: 3-4%
- Healthcare as % of GDP: 18% (and rising)
- New MOB deliveries: Down 25% from 2019 levels
And here is how the space performs against traditional office:
| Metric | Medical Office | Traditional Office |
|---|---|---|
| Average Vacancy | 8.2% | 17.2% |
| Rent Growth (5-yr avg) | 3.1% | 1.2% |
| Tenant Retention | 85% | 65% |
| Average Lease Term | 7-10 years | 5-7 years |
Why healthcare is going retail
1. Consumer convenience
Patients want their doctor to be as easy to reach as anything else they do in a day:
- Within 15 minutes of home
- Easy parking, no garage to navigate
- Evening and weekend hours
- Retail-quality space
2. Cost efficiency
The rent math is the real driver. A provider saves a lot by moving off campus:
| Cost Factor | Hospital Campus | Retail Location | Savings |
|---|---|---|---|
| Rent/SF | $45-65 | $25-35 | 30-45% |
| Build-out | $200+ | $120-150 | 25-40% |
| Parking | Structured ($25K/space) | Surface (included) | 90%+ |
3. Regulatory shift
Medicare reimbursement now favors outpatient settings. The same procedure gets reimbursed at a lower rate when it is done in a hospital, so providers have a financial reason to be off campus.
Tenant categories driving demand
Primary care and urgent care
These tenants take 3,000-8,000 SF on 7-10 year leases and can carry $28-38/SF NNN. What they need: ground floor, parking, and visibility.
Specialty practices
The specialties leasing the most space right now:
| Specialty | Typical SF | Growth Driver |
|---|---|---|
| Orthopedics | 8,000-15,000 | Aging population |
| Dermatology | 3,000-6,000 | Cosmetic + medical |
| Ophthalmology | 5,000-10,000 | Cataract procedures |
| Cardiology | 6,000-12,000 | Preventive care |
| Physical Therapy | 3,000-5,000 | Post-acute care |
Behavioral health
This is the fastest-growing piece of the market. Mental health clinics run 3,000-8,000 SF, substance abuse treatment 5,000-15,000 SF, and autism therapy 8,000-20,000 SF.
Central Massachusetts medical office market
Demand drivers
The demographics here support healthcare growth. Worcester County's median age is 40.2 years, the 65-and-over population is growing 3% annually, and Massachusetts has an insured rate above 97%.
The big health systems anchoring the demand are UMass Memorial Health (the largest employer in the region), St. Vincent Hospital, Reliant Medical Group, and Fallon Health.
Current market conditions
Where Worcester County stands today:
| Metric | Worcester County |
|---|---|
| MOB inventory | 4.2 million SF |
| Vacancy | 6.8% |
| Average rent | $26-32/SF NNN |
| Cap rates | 6.5-7.5% |
Investment considerations
Location selection
What I look for in a site:
| Factor | Target |
|---|---|
| Population (3-mile) | 30,000+ |
| Median age | 40+ (healthcare utilization) |
| Household income | $60,000+ (insurance coverage) |
| Traffic count | 20,000+ ADT |
| Parking ratio | 5+ per 1,000 SF |
Lease structures
The terms you typically see on a medical deal: an initial term of 7-10 years, two 5-year renewal options, annual rent escalations of 2.5-3%, and a TI allowance of $40-80/SF depending on the tenant's credit. Structure is usually NNN or Modified Gross.
My read on the investment case
Here is why I like medical office. Healthcare demand is non-discretionary, so it holds up when other sectors soften. The aging population keeps pushing utilization higher. The specialized build-out requirements keep new supply in check. The leases are long and renew at high rates. And the yield runs 50-100 bps above traditional office. Those five things line up in the same direction, which is rare.
Lornell Real Estate tracks medical office opportunities across Central Massachusetts. Contact us to discuss healthcare real estate investment strategies.
Limitations: Market data, projections, and trend analyses reflect conditions at publication. Commercial real estate markets are inherently cyclical, and submarket and property-level performance can diverge significantly from the regional averages cited. Demographic data, employer information, and regulatory conditions are subject to change. This article does not constitute investment advice. Conduct property-specific due diligence and consult qualified professionals before making investment decisions.
Sources & References
- CBRE
- Cushman & Wakefield
- Statista
This article cites data from the sources listed above. For the most current figures, consult the original publications directly.
Data current as of publication date. Market conditions, rates, and regulations may have changed. Consult a qualified commercial real estate professional before making investment decisions.
Get the full Central MA market data
Commercial tax-base growth, development activity, and demographics across Central MA, town by town.