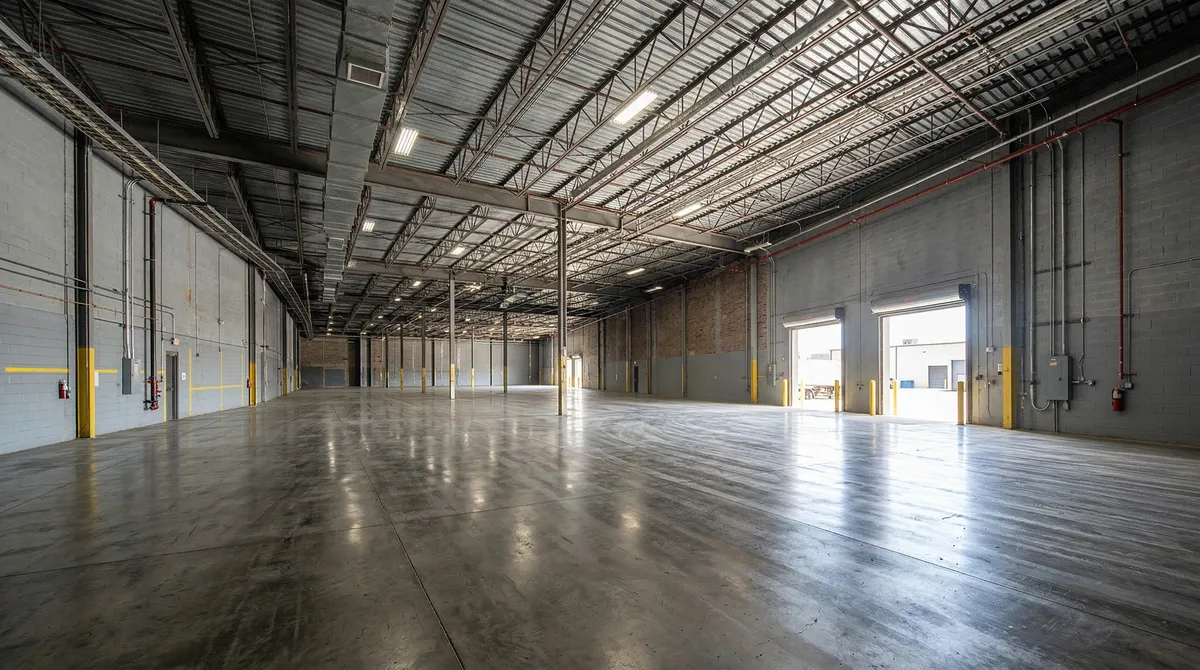
Worcester County's industrial market is tight. Vacancy sits at 4-6%, small warehouse spaces under 6,000 square feet lease in days instead of weeks, and rents are up 15-20% since 2020. In a market this competitive, the industrial broker you hire in Worcester, MA decides whether you land the right space at the right price or watch it go to someone else.
Tight market: Worcester County's industrial market is highly competitive, with 18 million+ square feet of inventory and low 4-6% vacancy rates.
Cost advantage: Industrial lease rates in Worcester range from $6 to $12 per square foot NNN, representing a 30-50% discount compared to Greater Boston.
Investment opportunity: The average cap rate for Worcester industrial investment properties is 6.68%, significantly outperforming the sub-5% rates in primary markets.
Off-market deals: The best industrial spaces in Worcester often move through broker relationships before ever hitting the open market.
Specialized expertise: Choosing a broker with deep knowledge of industrial property specifics and local zoning classifications is critical for success.
Cap Rate is the capitalization rate, a ratio used by investors to estimate the potential return on a real estate investment, calculated by dividing the property's net operating income by its current market value.
18 million+ square feet of industrial inventory across Worcester County, with vacancy rates at just 4-6%.
$6 to $12 per square foot NNN for industrial lease rates, totaling 30-50% below comparable Greater Boston space.
4.5 million people within 50 miles of Worcester, making it a prime distribution hub for all of New England.
6.68% average cap rate for industrial investment properties, well above the sub-5% rates in primary markets.
3 major interstate highways (I-90, I-290, I-190) provide direct access to Boston, Hartford, Providence, and Springfield.
Why the broker you pick actually matters here
Not every commercial broker understands industrial. These buildings carry requirements that office and retail brokers rarely touch: clear ceiling heights, column spacing for racking, dock-high versus drive-in loading, three-phase power capacity, truck court depth, ESFR sprinkler systems, and environmental history that can kill a deal.
Worcester adds another layer. The industrial inventory here runs through three distinct corridor types, each with its own zoning, its own tenant profile, and its own pricing. A broker who can't tell you the difference between an ML zone and an MG zone, or which corridors are seeing the most demand pressure, is going to cost you time and money.
""In a market with 4-6% vacancy, the best industrial spaces in Worcester never hit the open market. They move through broker relationships before a listing sheet is ever created," says **Todd Lornell**, Principal & Founder, Lornell Real Estate
What the Worcester numbers actually say
Before you evaluate brokers, understand what you're walking into. This market has changed in the last five years.
Current Market Snapshot (2026)
| Metric | Worcester County | Greater Boston |
|---|---|---|
| Total Industrial Inventory | 18 million+ SF | 175 million+ SF |
| Vacancy Rate | 4-6% | 5-7% |
| Average Lease Rate | $6-12/SF NNN | $14-22/SF NNN |
| Average Sale Price | $235/SF | $400+/SF |
| Average Cap Rate | 6.68% | <5.0% |
| Clear Heights (Modern) | 28-32' | 28-36' |
The price gap is the story. Worcester industrial costs 30-50% less than comparable Boston-area space, and you get the same regional labor pool and the same highway network. For e-commerce fulfillment, manufacturing, and distribution tenants, that math is hard to argue with.
Prologis projects e-commerce companies will account for 25% of all new industrial leasing nationally in 2026. Worcester sits at the intersection of I-90, I-290, and I-190, with 4.5 million people inside a 50-mile radius. It's going to catch a lot of that demand.
The three industrial corridors
A broker who knows Worcester will put you on the right corridor fast, based on what you actually need:
Route 20 / Stafford Street Corridor
Heavy industrial zoning (MG), which takes manufacturing, outdoor storage, and heavy logistics. High power capacity, potential rail access, and larger lots. Lease rates typically run $6-8/SF NNN. This is where heavy manufacturing, waste processing, and large-scale distribution operate.
Quinsigamond Avenue / Millbury Street Corridor
Worcester's warehouse and distribution backbone. Right up against I-290, so the truck routes to the regional highway network are the shortest you'll find. Properties average 20,000-80,000 square feet with dock-high loading, and lease rates run $8-10/SF NNN. E-commerce fulfillment and third-party logistics tenants have taken most of the recent leasing here.
West Boylston / Holden Line Corridor
Newer flex and light industrial with modern specs. Higher clear heights (24-32 feet), better column spacing, and cleaner finishes than the older Worcester stock. Lease rates run $9-12/SF NNN. This corridor pulls biotech, advanced manufacturing, and R&D tenants who need industrial function with office-grade common areas.
What to look for in a Worcester industrial broker
1. Corridor-level market knowledge
Ask any broker you're considering: "Which Worcester corridor is right for my operation, and why?" A qualified industrial broker answers on the spot, naming specific streets, zoning districts, and recent comparable deals. Not generalities.
The right broker knows Stafford Street has different power infrastructure than Quinsigamond Avenue. They know which buildings have 32-foot clear heights and which have 18-foot ceilings. They know which landlords will move on tenant improvement allowances and which properties carry environmental constraints from prior use.
2. Off-market access
In a 4-6% vacancy market, the best industrial in Worcester often trades before it reaches LoopNet or CoStar. A broker worth hiring keeps direct relationships with owners, tracks lease expirations across their coverage area, and spots opportunities before they go public.
This matters most for small warehouse spaces under 6,000 square feet. Demand is extreme and they move almost immediately once they're available. If you're working from online listings alone, you're looking at yesterday's inventory.
3. Industrial-specific transaction experience
Industrial deals involve technical due diligence that's a different animal from office or retail:
- Environmental assessments: Phase I and Phase II Environmental Site Assessments are standard on industrial properties. A broker who does this work knows which buildings carry legacy contamination risk and how to negotiate environmental indemnifications.
- Building specifications: Clear height, column spacing, floor load capacity, power availability, dock configurations, and truck court depth all decide whether a property works for your operation. Your broker should check those specs against your requirements before you ever tour the place.
- Zoning compliance: Worcester's ML (Manufacturing Limited) and MG (Manufacturing General) zones allow different uses. ML permits light assembly, R&D, and clean manufacturing. MG permits heavy manufacturing, outdoor storage, and more intensive operations. Get the zoning wrong and a deal can fall apart after months of work.
- Tax incentives: Worcester's Opportunity Zones and Tax Increment Financing (TIF) programs can meaningfully cut the cost of an acquisition or buildout. Your broker should flag these up front, not leave them for your accountant to stumble onto.
4. Both sides of the table
The strongest industrial brokers represent landlords and sellers as well as tenants and buyers. Seeing both sides means they read pricing from every angle, know what a landlord will accept before you write an offer, and can structure a deal that works for everyone.
At Lornell Real Estate, we represent institutional and private owners on disposition and leasing assignments while advising tenants and investors on acquisitions at the same time. We see deal flow from both directions, and we move faster because of it.
5. Data behind the pricing
Asking rent is not market rent. A strong industrial broker gives you comparative market analysis that goes past listing prices to actual closed transactions, concession packages, and effective rent. They should be able to tell you:
- What similar properties have actually leased for, not just what they listed at
- How much free rent or tenant improvement allowance landlords are giving
- Whether rents in a specific corridor are climbing, flat, or softening
- What cap rates industrial investment properties are trading at
Questions to ask before you hire
Use these to size up any industrial broker in Worcester, MA:
- "How many industrial transactions have you closed in Worcester County in the past 24 months?" Look for specifics. A broker who gives you a number and can describe the deals has credibility. One who pivots to their office or retail experience does not.
- "Which Worcester industrial corridor would you recommend for my operation, and why?" This tests local knowledge right away. The answer should name specific streets, zoning classifications, and recent comparable tenants, not vague talk about "good access to highways."
- "What percentage of your recent industrial deals involved off-market properties?" In a tight market, this separates brokers with real landlord relationships from those leaning on listing databases.
- "Can you walk me through the environmental due diligence process for an industrial acquisition in Worcester?" Industrial carries environmental risk. Your broker should be fluent in Phase I/II ESA procedures, MassDEP reporting requirements, and environmental indemnification structures.
- "What market data do you use to support pricing recommendations?" A data-driven broker points to CoStar, their own transaction database, and market reports. One who quotes "market rate" with nothing behind it is guessing.
Why Lornell Real Estate for industrial in Worcester
We started Lornell Real Estate on a simple idea: brokerage should pair deep local knowledge with institutional-quality analysis. For industrial clients in Worcester County, that means:
35+ years of commercial real estate experience across investment sales, leasing advisory, and development, covering every property type in Central Massachusetts.
Full corridor coverage across Route 20/Stafford Street, Quinsigamond Avenue/Millbury Street, and the West Boylston/Holden line, with active landlord relationships in each.
Representation on both sides, owners and tenants alike, which gives us a read on deal flow from every direction and lets us find opportunities before they reach the broader market.
Advisory backed by data, where every recommendation rests on comparable transactions, market trend analysis, and property-specific financial modeling. We publish regular research on industrial trends, e-commerce demand drivers, and Worcester County investment conditions.
A track record: Lornell Real Estate was named a CoStar Group Quarterly Deals winner in Q2 2025 for an industrial warehouse lease in Worcester County.
Whether you're a distribution company chasing warehouse space near I-290, a manufacturer weighing a build-to-suit on Stafford Street, an investor targeting industrial cap rates above 6%, or a business owner buying your first industrial building, our team knows this market at the corridor level.
Getting started
The Worcester industrial market isn't slowing down. Vacancy stays at historic lows, e-commerce demand keeps absorbing available inventory, and rents will likely keep climbing as long as supply stays tight.
If you're weighing an industrial lease, acquisition, or disposition in Worcester County, start with a market consultation. We'll go through your requirements, size, specs, location, budget, and timeline, and give you a straight read on what's available, what it costs, and where the openings are.
Contact Lornell Real Estate at (774) 745-0015 or [email protected] to schedule a consultation. You can also browse our current industrial listings and explore our Worcester market research.
The data referenced in this article is sourced from CoStar Group, Prologis Industrial Research, the Worcester Regional Chamber of Commerce, and Lornell Real Estate's proprietary transaction database. All figures are current as of March 2026.
Limitations: Market data, projections, and trend analyses reflect conditions at publication. Commercial real estate markets are inherently cyclical, and submarket and property-level performance can diverge significantly from the regional averages cited. Demographic data, employer information, and regulatory conditions are subject to change. This article does not constitute investment advice. Conduct property-specific due diligence and consult qualified professionals before making investment decisions.
Sources & References
- CoStar
- CoStar Group
- Prologis
This article cites data from the sources listed above. For the most current figures, consult the original publications directly.
Data current as of publication date. Market conditions, rates, and regulations may have changed. Consult a qualified commercial real estate professional before making investment decisions.
Get the full Central MA market data
Commercial tax-base growth, development activity, and demographics across Central MA, town by town.