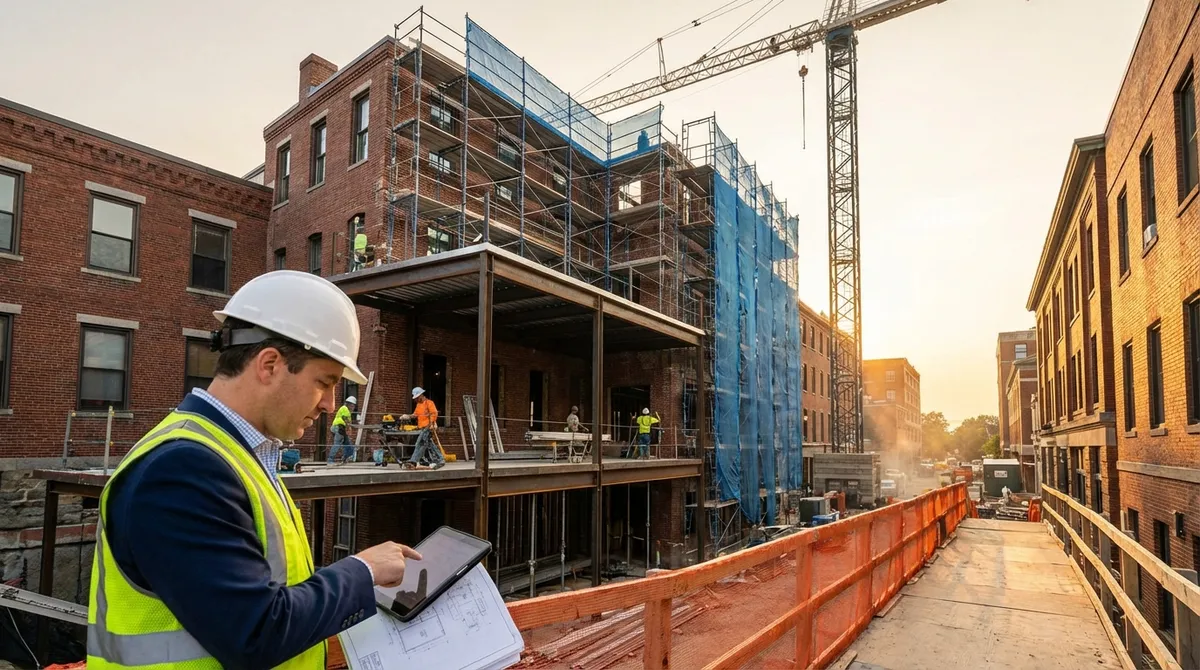
Worcester issued 2,666 commercial building permits in 2024, an 87% increase from the 1,427 filed in 2020. That is not a typo. In five years the city's commercial construction and renovation pipeline nearly doubled, and 2025 is tracking around 2,500 permits, on pace to hold the trend.
Worcester's commercial building activity has run hard: permits rose 87%, from 1,427 in 2020 to 2,666 in 2024.
Most of that money is going into existing buildings. Alteration and renovation permits totaled 1,595 from 2023-2025.
Institutions and healthcare are leading the spend. 1 College Street pulled 74 permits and 119 Belmont Street pulled 70.
Code compliance and energy efficiency are driving work too. Fire safety permits jumped 161% and insulation permits went from near-zero to 155 in 2024.
Ground-up development is the construction of an entirely new building or complex on previously undeveloped land, or on a site where existing structures have been demolished to make way for new construction.
I analyzed over 7,000 commercial permits from the Worcester Permits and Inspections System (WPIS) database covering 2023 through 2025 to see which neighborhoods are pulling capital, what kind of work is getting done, and what the data means for commercial real estate investors. What I found is a city reinvesting in itself broadly, not in one district but across institutional, healthcare, commercial, and industrial corridors.
2,666 commercial permits issued in 2024, up 87% from 1,427 in 2020.
1,595 alteration and renovation permits filed 2023-2025, making building upgrades the dominant permit category.
1 College Street (College of the Holy Cross) led all addresses with 74 permits, followed by 119 Belmont Street (70 permits) and 70 Gold Star Boulevard (45 permits).
Fire safety permits (sprinklers + fire alarms) surged 161% from 75 in 2020 to 196 in 2024, indicating significant building code compliance upgrades.
Insulation permits exploded from near-zero before 2022 to 155 in 2024, reflecting energy efficiency mandates and retrofit investment.
The big picture: five years of accelerating permit activity
Before I get into neighborhoods and categories, look at the trajectory. Worcester's commercial permit volume has climbed every year since 2020, and the sharpest jump landed in 2023.
| Year | Total Commercial Permits | Year-Over-Year Change |
|---|---|---|
| 2020 | 1,427 | , and |
| 2021 | 1,617 | +13.3% |
| 2022 | 1,604 | -0.8% |
| 2023 | 2,251 | +40.3% |
| 2024 | 2,666 | +18.4% |
| 2025 | 2,260 (partial year) | On pace for ~2,500 |
The 40.3% jump from 2022 to 2023 is the inflection point. A few things hit at once that year: federal infrastructure and climate money reaching local projects, Canal District momentum picking up, institutional capital committing to campus renovations, and the healthcare sector catching up on post-pandemic facility work.
The 2024 figure of 2,666 permits is the highest in this dataset. The 2025 partial-year count of 2,260 says the pace is holding, though the full-year total may land a touch below the 2024 peak.
What is being built: the permit categories that tell the story
Not all permits carry the same weight. A new construction permit means ground-up work. An alteration permit means somebody is reinvesting in existing stock. A fire alarm or sprinkler permit means a building upgrade, often required before a change of occupancy or a major tenant buildout. Read the permit mix and you can see what kind of capital is moving into Worcester's commercial buildings.
Top permit categories (2023-2025 combined)
| Category | Total Permits | % of Total |
|---|---|---|
| Alteration/Renovations/Repairs | 1,595 | 22.2% |
| Plumbing | 1,289 | 17.9% |
| Gas | 979 | 13.6% |
| Mechanical (HVAC) | 481 | 6.7% |
| Miscellaneous Repairs/Piping | 448 | 6.2% |
| Roofing | 444 | 6.2% |
| Insulation | 317 | 4.4% |
| Sprinkler Alteration | 282 | 3.9% |
| Signage (Ground/Wall) | 278 | 3.9% |
| Fire Alarm Alterations | 233 | 3.2% |
| New Sprinkler Systems | 154 | 2.1% |
| New Fire Alarm Systems | 145 | 2.0% |
| New Construction | 62 | 0.9% |
| Demolition | 55 | 0.8% |
Reading between the lines
Alterations dominate. The 1,595 alteration and renovation permits dwarf every other category. Worcester's commercial story right now is not ground-up development, it's existing buildings getting upgraded, repositioned, and re-tenanted. For investors, that backs up the value-add thesis: real money is flowing into improving Worcester's existing stock, and that drives rent growth and property values.
Fire safety investment is climbing. Combined sprinkler and fire alarm permits, both new installs and alterations, totaled 814 over three years. That work usually comes right before or alongside a change of use or a major fit-out. When a building gets a new fire alarm system, somebody is putting serious capital into that property.
Signage permits point to new tenants. The 278 signage permits are businesses putting up or refreshing their physical presence, a direct read on commercial leasing activity.
Demolition is restrained. Only 55 demolition permits in three years. Worcester is renovating, not tearing down. The building stock is getting improved, not replaced.
Year-over-year trends: the categories that moved most
Alteration and renovation permits
| Year | Alteration Permits | Change |
|---|---|---|
| 2020 | 266 | , and |
| 2021 | 302 | +13.5% |
| 2022 | 297 | -1.7% |
| 2023 | 525 | +76.8% |
| 2024 | 567 | +8.0% |
| 2025 | 503 | (partial year) |
Alteration permits nearly doubled from 2022 to 2023 and have held that level through 2025. This is the single most important line in the dataset. Building owners across Worcester are putting capital into renovations at twice the rate they were three years ago. That spending shows up later as higher assessed values, higher achievable rents, and better building quality.
Fire safety permits (sprinklers + fire alarms)
| Year | Fire Safety Permits | Change |
|---|---|---|
| 2020 | 75 | , and |
| 2021 | 62 | -17.3% |
| 2022 | 92 | +48.4% |
| 2023 | 134 | +45.7% |
| 2024 | 196 | +46.3% |
| 2025 | 162 | (partial year) |
Fire safety permit volume rose 161% from 2020 to 2024. This is a leading indicator of building repositioning. Massachusetts code requires fire protection upgrades when a commercial building changes occupancy, goes through a major renovation, or takes on a higher occupant load. The steady climb tells me buildings across Worcester are not just getting a cosmetic refresh, they're being structurally upgraded for new and heavier uses.
Insulation permits (energy efficiency)
| Year | Insulation Permits |
|---|---|
| 2020 | ~0 |
| 2021 | ~0 |
| 2022 | ~0 |
| 2023 | 51 |
| 2024 | 155 |
| 2025 | 111 (partial year) |
This category basically didn't exist in commercial permits before 2023. The jump to 155 permits in 2024 comes from a few forces converging: Massachusetts energy code updates demanding better building envelope performance, utility incentive programs subsidizing commercial insulation retrofits, and owners reacting to high energy costs by investing in efficiency. If you're evaluating older commercial buildings, the insulation trend says energy retrofits are becoming standard practice in this market.
New construction
| Year | New Construction Permits |
|---|---|
| 2020 | 16 |
| 2021 | 16 |
| 2022 | 17 |
| 2023 | 23 |
| 2024 | 25 |
| 2025 | 14 (partial year) |
New construction permits rose modestly from 16 to 25 between 2020 and 2024, a 56% gain. The 2025 partial-year count of 14 suggests the full year could come close to prior years. New construction here is steady, not explosive. The real action is in renovations. For a closer look at ground-up projects, see our Worcester development tracker.
Where the permits are: the most active commercial addresses
The geography of the permits shows which institutions and properties are driving the most activity. These are the addresses with the highest permit counts from 2023 through 2025.
| Rank | Address | Total Permits | Notable Context |
|---|---|---|---|
| 1 | 1 College St | 74 | College of the Holy Cross, and major campus renovations |
| 2 | 119 Belmont St | 70 | UMass Memorial Medical Center corridor |
| 3 | 70 Gold Star Blvd | 45 | Includes demolition and new construction permits |
| 4 | 446 Main St | 38 | Downtown commercial corridor |
| 5 | 100 Research Dr | 32 | Research/biotech corridor |
| 6 | 100 Front St | 31 | Mercantile Center / Hanover Theatre district |
| 7 | 68 Stafford St | 30 | Industrial corridor |
| 8 | 600 Main St | 30 | Downtown commercial core |
| 9 | 123 Summer St | 29 | Downtown mixed-use |
| 10 | 55 Salisbury St | 28 | Institutional area near WPI |
What the address data shows
Institutional anchors are driving the volume. The top two addresses, 1 College Street (Holy Cross) and 119 Belmont Street (near UMass Memorial), account for 144 permits combined. Higher education and healthcare are the biggest sources of commercial construction in Worcester, and their capital improvement cycles keep contractors, materials suppliers, and ancillary commercial services busy.
Downtown is active across several blocks. Between 446 Main Street (38 permits), 100 Front Street (31 permits), 600 Main Street (30 permits), and 123 Summer Street (29 permits), the downtown core generated 128 permits across just four addresses. That lines up with the Canal District and downtown investment momentum that has reshaped Worcester's urban core over the past decade.
The biotech corridor is spending too. 100 Research Drive pulled 32 permits, a sign that Worcester's life sciences and research corridor keeps attracting capital for facility buildouts and upgrades.
Gold Star Boulevard stands out. 70 Gold Star Boulevard's 45 permits include both demolition and new construction filings, which points to a real redevelopment project rather than incremental renovation. Gold Star Boulevard runs through Worcester's commercial and retail zone near I-290, so it's a high-visibility location.
""Permit data is the earliest public signal of where capital is moving. By the time a renovation is complete and a property hits the market, the chance to buy at pre-improvement pricing has passed. Investors who track permit activity can spot the neighborhoods and corridors where values are about to shift, and position accordingly," says **Todd Lornell**, Principal & Founder, Lornell Real Estate
Recent new construction permits (2024-2025)
Renovations dominate, but ground-up commercial construction keeps going across several Worcester neighborhoods. These are recent new construction permits filed in 2024 and 2025.
| Address | Date Filed | Notes |
|---|---|---|
| 73 Merrick St | Sept 2025 | , and |
| 105 Stafford St | Sept 2025 | Stafford St industrial corridor |
| 494 Lincoln St | Apr 2025 | Lincoln St commercial corridor |
| 1075 Grafton St | Apr 2025 | East side, near Shrewsbury line |
| 40A/40G Butler St | Apr 2025 | , and |
| 55 Great Brook Valley Ave | Apr 2025 | , and |
| 41 Abrasives Way | Jun 2024 | Industrial zone |
| 589 Plantation St | Jul 2024 | UMass Medical/biotech corridor |
The spread is worth noting. New construction is landing on Stafford Street (industrial), Grafton Street (east-side commercial), Lincoln Street (commercial), Plantation Street (biotech/medical), and Merrick Street. This is not a one-neighborhood story, it's citywide.
The 589 Plantation Street filing matters. Plantation Street is Worcester's main biotech and medical corridor, home to UMass Medical School, UMass Memorial Medical Center, and multiple life sciences companies. New construction there reinforces the corridor's path as a regional biotech hub. For more on this, see our analysis of industrial and e-commerce demand pulling investment into Worcester's commercial corridors.
What this means for CRE investors and tenants
For investors
Follow the renovation wave. The 1,595 alteration permits filed in 2023-2025 are owners putting money into their properties. Buildings next to or in the same corridors as heavy renovation activity benefit from rising area quality, a better tenant mix, and upward pressure on rents. The addresses with the highest permit counts mark the epicenters of that reinvestment.
Watch fire safety permits as a leading indicator. A spike in sprinkler and fire alarm permits at one address often comes right before a change of use or a major re-tenanting. If a building is getting $200,000+ in fire protection upgrades, somebody has committed capital and they expect a return.
Track insulation permits for energy retrofit plays. Insulation showing up as a major category tells me energy performance is becoming a competitive edge for commercial buildings in Worcester. Properties that haven't been retrofitted may face pressure from tenants and from regulation.
For tenants
Renovation activity means better options. The surge in alteration permits translates straight into more and better space. Buildings that were Class C two years ago are being brought up to Class B. Tenants shopping in 2026 will find a meaningfully different inventory than what was on the market in 2022.
Downtown is the deepest market. With 128+ permits across four downtown addresses alone, the downtown core and Canal District hold the highest concentration of recently upgraded space. If you want to be near dining, transit, and workforce amenities, focus the search on the 100-600 Main Street corridor and the Mercantile Center area.
For developers
Demolition-plus-new-construction addresses are redevelopment plays. Addresses like 70 Gold Star Boulevard that show both demolition and new construction permits signal active redevelopment. Adjacent parcels or properties in the same corridor may ride the same market dynamics driving those projects.
New construction is dispersed, not concentrated. The 2024-2025 new construction permits span industrial corridors (Stafford St, Abrasives Way), biotech (Plantation St), and commercial corridors (Grafton St, Lincoln St). Worcester is not building in one place, it's building across its whole commercial geography.
Methodology and data source
All permit data in this analysis came from the Worcester Permits and Inspections System (WPIS) database, filtered for commercial occupancy types. The dataset includes permits with record types classified as commercial across every category (new construction, alteration, demolition, plumbing, mechanical, electrical, fire protection, insulation, roofing, and signage). Residential permits and residential occupancy types were excluded. The 2025 data reflects permits filed through the date of publication and is annualized where year-over-year comparisons are made.
Explore Worcester's commercial market
The permit data confirms what I see on the ground every day: this is a city in active reinvestment mode. Capital is going into building upgrades, fire safety, energy retrofits, and selective new construction across every major commercial corridor. For investors, tenants, and developers, the question is not whether Worcester is growing. The permits prove it is. The question is where to position.
Browse our current Worcester County listings or dig into our Worcester market research for property-level data on the neighborhoods and corridors in this analysis. Contact Lornell Real Estate at (774) 745-0015 or [email protected] to talk through specific opportunities.
Data sourced from the Worcester Permits and Inspections System (WPIS) database. All figures are current as of March 2026.
Data current as of publication date. Market conditions, rates, and regulations may have changed. Consult a qualified commercial real estate professional before making investment decisions.
Get the full Central MA market data
Commercial tax-base growth, development activity, and demographics across Central MA, town by town.