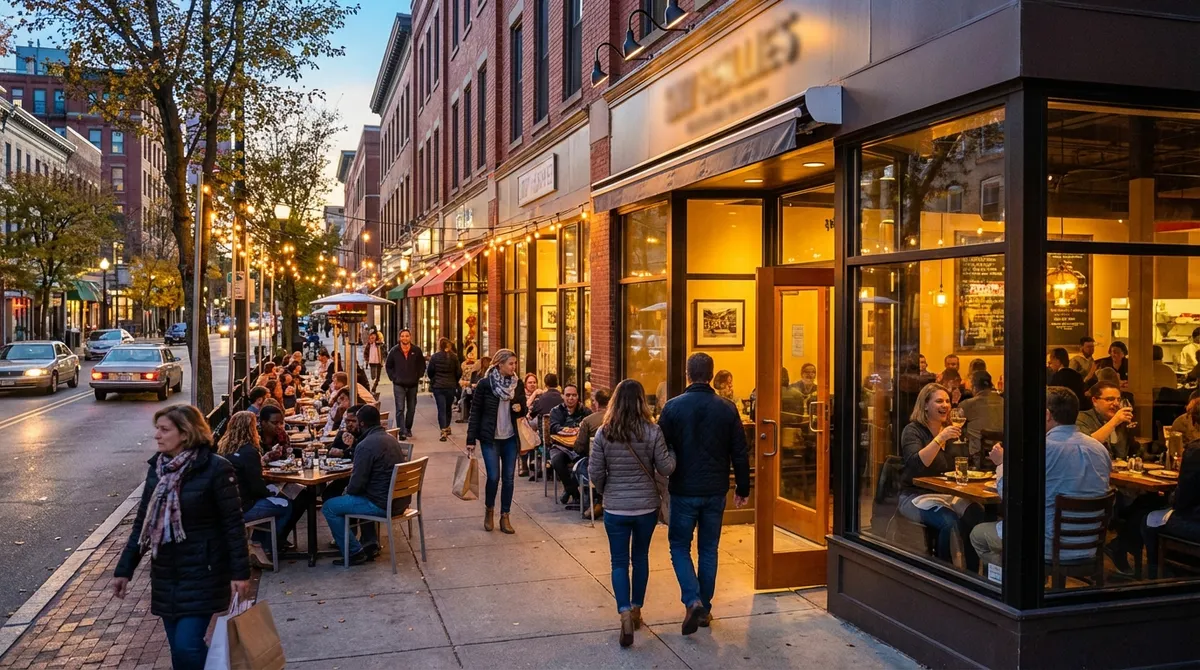
Worcester issued 1,212 food establishment licenses across 848 unique locations in 2025. That is a 225% jump over the 373 licenses issued in 2024, and it is not a rounding error. It is the sharpest single-year jump in food and beverage activity in the WPIS database, and in 35 years of leasing retail here I read that straight through to vacancy, lease rates, and returns across the city's commercial corridors.
Worcester issued 1,212 food licenses in 2025, up 225% over 2024. That is a lot of new food businesses looking for space.
1,131 of the small-restaurant licenses (1-100 seats) came in 2023-2025, so the demand is for sub-3,000 SF rooms.
2 Washington Square (the Worcester Public Market area) pulled 158 food licenses from 2023-2025, the densest food address in the city.
31 commissary kitchen licenses in 2023-2025 tell me shared kitchens and ghost kitchens are now a real category.
A commissary kitchen is a licensed commercial cooking facility that multiple food businesses share, caterers, food trucks, and ghost kitchens, for food prep, storage, and operating space.
1,212 food licenses issued in 2025 across 848 unique locations, up 225% over 2024 (Worcester WPIS database).
1,131 small restaurant licenses (1-100 seats) issued 2023-2025. Sub-3,000 SF restaurant space is what operators actually want.
158 food licenses at 2 Washington Square (2023-2025), the densest food address in the city, the Worcester Public Market area.
31 commissary kitchen licenses issued 2023-2025. Ghost kitchens and shared production are now their own category.
~900 new business certificates per year since 2022, with 28,764 total certificates in the city's system.
What the food license counts show, 2020-2025
The Worcester Permits and Inspections System (WPIS) logs every food establishment license the city issues. Line the years up and the demand picture is plain:
| Year | Licenses Issued | Unique Locations | YoY Change |
|---|---|---|---|
| 2020 | 2,502 | 987 | , and |
| 2021 | 818 | 425 | -67% (pandemic) |
| 2022 | 216 | 167 | -74% |
| 2023 | 206 | 148 | -5% |
| 2024 | 373 | 309 | +81% |
| 2025 | 1,212 | 848 | +225% |
The 2,502 licenses in 2020 are the pre-pandemic baseline, a fully operating city with established businesses renewing and new operators coming in. The 2021-2023 collapse is pandemic closures, deferred renewals, and a startup freeze. The 2024 bounce (+81%) was real, but 2025 running to 1,212 is a different animal. My read is a structural shift in who is starting food businesses in Worcester.
This matters for real estate because every one of those licenses needs a physical space. A restaurant license means a lease. A commissary kitchen license means a kitchen build-out. A retail food license means a storefront. License volume runs ahead of retail absorption; it tells you what is coming before the vacancy numbers move.
Which food businesses are driving the demand
The license type tells you the kind of space. Here is the 2023-2025 breakdown:
| License Type | Count (2023-2025) | Space Implication |
|---|---|---|
| Food & Drink Est. 1-100 seats | 1,131 | Small restaurant/cafe: 1,000-3,000 SF |
| Retail Food Only | 262 | Grocery, convenience, specialty: 800-10,000 SF |
| Food & Drink Est. 101-499 seats | 111 | Mid-size restaurant: 3,000-8,000 SF |
| Public School | 86 | Institutional (not market-driven) |
| Institutional | 78 | Institutional (not market-driven) |
| Commissary Kitchen | 31 | Shared kitchen / ghost kitchen: 2,000-5,000 SF |
| Retail over 10,000 SF | 26 | Large-format grocery/retail |
| Food & Drink Est. 500+ seats | 20 | Large venue: 8,000+ SF |
| Bakery | 19 | Specialty bakery: 800-2,000 SF |
| Retail/Bakery/Restaurant Hybrid | 14 | Multi-use format: 1,500-4,000 SF |
| Retail w/ Bakery | 11 | Retail with production: 1,200-3,000 SF |
Small restaurants are the bulk of it
The number that matters is 1,131 small restaurant licenses (1-100 seats). That is the core of the growth: independent operators, ethnic kitchens, fast-casual concepts, neighborhood spots. Each one typically takes 1,000 to 3,000 square feet of first-floor retail with a grease trap, hood ventilation, and ADA-compliant restrooms.
If you own the building, that is a good tenant to have. Small restaurant tenants sign 5-10 year leases, put $100-200 per SF into the kitchen build-out themselves, and pull foot traffic that helps the tenants next door. The hard part is finding restaurant-ready space, or more honestly, finding a landlord willing to spend on the infrastructure that makes a space restaurant-ready.
Commissary kitchens are worth a look
The 31 commissary kitchen licenses are a newer category. Since the pandemic, ghost kitchens and shared commercial kitchens have become a lower-risk way in, a place to test a concept on delivery platforms before signing a full restaurant lease. They need 2,000-5,000 SF of industrial or flex space with commercial kitchen infrastructure, which makes them a conversion play for warehouse or light industrial that is sitting half-used.
Where the demand is concentrated
The busiest food license addresses in the WPIS database (2023-2025) line up with Worcester's most active commercial corridors:
| Address | Licenses (2023-2025) | Context |
|---|---|---|
| 2 Washington Square | 158 | Worcester Public Market / food hall area |
| 25 Francis Street | 75 | Near downtown core |
| 100 Madison Street | 39 | Commercial/mixed-use |
| 160 Green Street | 32 | Canal District |
| 1 College Street | 13 | College of the Holy Cross |
| 486 Chandler Street | 11 | West side commercial |
| 950 Main Street | 8 | Main Street corridor |
| 72 Shrewsbury Street | 5 | Restaurant Row |
| 1 Kelley Square | 5 | Kelley Square / Canal District |
2 Washington Square leads on density
The 158 food licenses at 2 Washington Square make the Worcester Public Market area the densest food destination in the city. The food hall model, several operators under one roof, is the kind of format that changes a corridor. Each operator carries its own food license, which is why the count runs so high at one address. For investors, a food hall or market is a way to fill a big footprint (10,000-30,000 SF) with several small tenants and still get premium per-SF rent.
Canal District and Shrewsbury Street
The 32 licenses at 160 Green Street and 5 at 1 Kelley Square track the Canal District's ongoing transformation from half-used industrial parcels into a walkable dining and entertainment district. Polar Park kicked it off, and the license data says the momentum has not stalled.
Shrewsbury Street, Worcester's original Restaurant Row, shows 5 licenses at 72 Shrewsbury Street by itself. Operators still want the address, but inline space there is getting hard to find.
Institutional demand
The 13 licenses at 1 College Street (College of the Holy Cross) are institutional food service. Worcester's four-college cluster (Holy Cross, WPI, Clark, Assumption) keeps steady demand going, both on-campus dining and the off-campus restaurants, cafes, and bars that feed students and faculty.
What this means for commercial real estate
Four things I take from this data if you invest, own, or broker in Worcester.
1. Retail vacancy should tighten
Every license is an operator who has either signed for space or is out looking. A 225% jump in licensing puts direct absorption pressure on retail and restaurant-zoned space. I expect measurable vacancy compression through 2026 in the retail corridors, downtown, the Canal District, and Shrewsbury Street most of all.
2. Restaurant-ready space gets a premium
The demand is for small restaurant spaces (1-100 seats, 1,000-3,000 SF) that already have kitchen infrastructure. A landlord who puts in the hood ventilation, grease traps, three-compartment sinks, and electrical capacity can get $3-5 per SF over standard retail rent. And because the restaurant tenant sinks $100-200 per SF of its own money into the build-out on top of any landlord TI, that basis keeps them renewing.
3. Ghost kitchen / commissary is a real asset class
Thirty-one commissary kitchen licenses in three years, in a city this size, is worth watching. These operators need 2,000-5,000 SF with commercial kitchen infrastructure, and they will take secondary locations, light industrial, flex, or lower-floor space, because their customers order through delivery apps instead of walking in. That is a conversion opportunity if you are sitting on warehouse or flex space that cannot win a traditional tenant.
4. Food hall and multi-tenant formats work
The 158 licenses at 2 Washington Square show Worcester can carry a high-density, multi-operator food concept. If you own a larger vacant retail box (10,000+ SF), put a food hall or market conversion on the feasibility list. It earns more per SF than a single anchor, makes its own foot traffic, and spreads your risk so one tenant walking away does not empty the building.
""The license data matches what I hear in every listing conversation. Restaurant and food tenants are the most active part of Worcester's retail leasing market right now. Small operators looking for 1,000 to 3,000 square feet are driving absorption in the Canal District, downtown, and on Shrewsbury Street. The landlords with restaurant-ready space are filling it faster and at higher rent than the ones marketing plain retail," says **Todd Lornell**, Principal & Founder, Lornell Real Estate
The wider business formation picture
Food licenses do not sit on their own. Worcester's business certificate data shows roughly 900 new certificates a year since 2022, with a peak of 1,120 in 2021. The city's system holds 28,764 certificates in total, which points to a wide base of small business that goes well past food and beverage.
That formation rate keeps demand up across property types, not just restaurant and retail but office, flex, and light industrial too. The food license jump is the most visible signal, but it sits on top of broader small-business growth that helps the whole Worcester commercial real estate market.
Implications for specific corridors
The Canal District, Green Street and Kelley Square, has the most upside. Polar Park anchors the traffic, residential development is adding density, and the license data shows steady operator interest, so this is where I would point a retail investor looking for appreciation and rent growth. Our Worcester market analysis has the corridor-level detail.
Shrewsbury Street is established and getting tight. Restaurant space on the street itself is scarce, so operators are spilling into the adjacent blocks. Watch for secondary spots within walking distance of the core Restaurant Row stretch.
Downtown and the Main Street corridor are getting their role back as a food destination, not just a daytime office district. The 8 licenses at 950 Main Street and the activity around Washington Square point that way. Mixed-use buildings with ground-floor restaurant space along Main Street should benefit.
Chandler Street and the west side show neighborhood-level growth: 11 licenses at 486 Chandler Street, mostly ethnic restaurants and convenience retail serving the residents around them. It is quieter than the Canal District or Shrewsbury Street, but it is stable, community-driven absorption.
How to position for this demand
If you are a landlord, walk your retail vacancies and ask which ones could become restaurants. Adding kitchen infrastructure (hood ventilation, grease traps, upgraded electrical) usually runs $40-80 per SF, and you can get that back through higher rent and faster absorption within 2-3 years of lease commencement.
If you are an investor, take a closer look at retail in the active food corridors, the Canal District, Shrewsbury Street, and downtown. The food license data gives you a real number to underwrite retail demand against, instead of guessing at foot traffic.
If you are a tenant or restaurateur hunting for space in the core dining districts, expect company. The 225% increase in food licensing means more operators are chasing the same restaurant-ready spaces. A broker with direct landlord relationships and off-market availability can be the difference between getting the location and watching it go to someone else. Our guide to finding commercial space in Worcester walks through the process.
Browse current Worcester listings or call Lornell Real Estate at (774) 745-0015 to talk through retail and restaurant space.
Data sourced from the Worcester Permits and Inspections System (WPIS) database. Business certificate data from Worcester city records. All figures current as of March 2026.
Limitations: Market data, projections, and trend analyses reflect conditions at publication. Commercial real estate markets are inherently cyclical, and submarket and property-level performance can diverge significantly from the regional averages cited. Demographic data, employer information, and regulatory conditions are subject to change. This article does not constitute investment advice. Conduct property-specific due diligence and consult qualified professionals before making investment decisions.
Sources & References
- Green Street
This article cites data from the sources listed above. For the most current figures, consult the original publications directly.
Data current as of publication date. Market conditions, rates, and regulations may have changed. Consult a qualified commercial real estate professional before making investment decisions.
Get the full Central MA market data
Commercial tax-base growth, development activity, and demographics across Central MA, town by town.