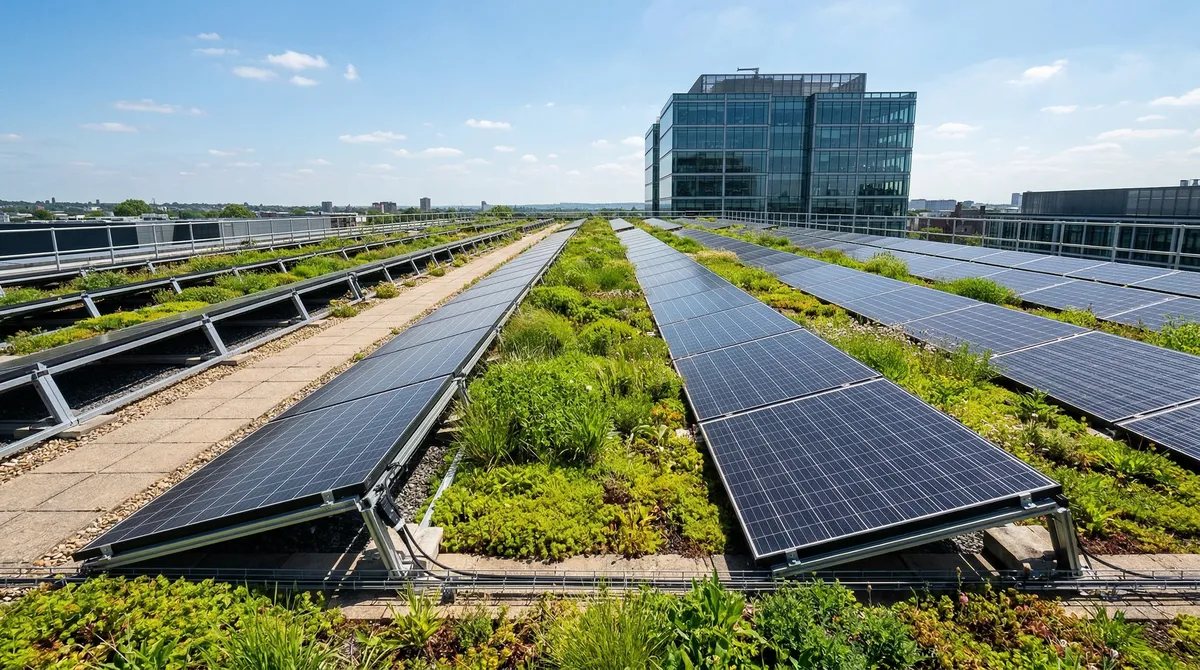
Green-certified commercial buildings command 6-10% rent premiums and sell for 10-15% more than comparable non-certified properties, according to CBRE. According to the U.S. Green Building Council, LEED-certified buildings achieve 94% average occupancy versus 89% for non-certified buildings, while operating costs run 15-25% lower due to energy and water efficiency improvements.
Financial premiums: Green-certified commercial buildings command 6-10% higher rents and sell for 10-15% more than comparable non-certified properties.
Operating cost savings: These buildings run 15-25% lower operating costs on energy and water efficiency.
Higher valuation: Green properties trade at 15-30 basis points tighter cap rates, which lifts the asset value directly.
What the market wants: ESG compliance is now what it takes to attract institutional capital, meet tenant demand, and stay ahead of regulation.
Where to start: Do the quick-win energy work first, like LED lighting, for 10-20% cuts in operating costs.
Cap rate is a real estate metric expressing the rate of return on a property based on its net operating income, calculated by dividing NOI by the property's purchase price or current market value.
Rent premium: Green-certified buildings command 6-10% higher rents than non-certified properties (CBRE)
Sale price premium: LEED-certified buildings sell for 10-15% more than comparable non-certified assets (U.S. Green Building Council)
Operating cost savings: 15-25% lower operating costs through energy and water efficiency (ENERGY STAR)
Cap rate compression: Green buildings achieve 15-30 basis points tighter cap rates, translating to significant value creation (CBRE)
Why ESG now moves deals
ESG used to be a nice-to-have. It isn't anymore. Institutional money is going into sustainable assets, tenants are asking for green buildings before they sign, and regulators are writing disclosure into law.
What the numbers say
Here is how green-certified stock stacks up against the rest:
| Metric | Green Certified | Non-Certified | Premium |
|---|---|---|---|
| Rental rates | Baseline | -6 to -10% | 6-10% |
| Occupancy | 94% | 89% | 5 pts |
| Operating costs | Baseline | +15-25% | 15-25% savings |
| Cap rate compression | 15-30 bps | Lower cap rate | |
| Tenant retention | 85% | 72% | 13 pts |
Buildings with LEED certification command 5-10% rent premiums and sell for 10-15% more than comparable non-certified buildings.
The certifications worth knowing
LEED
| Level | Points Required |
|---|---|
| Certified | 40-49 |
| Silver | 50-59 |
| Gold | 60-79 |
| Platinum | 80+ |
Cost to certify: $25,000-100,000+ depending on project size
ENERGY STAR
- Score 75+ required (top 25% of buildings)
- Annual benchmarking
- No certification cost (just verification)
WELL Building Standard
This one is about the people inside: air quality, water quality, light, fitness, comfort.
Putting ESG to work
Quick wins (low cost, high impact)
Start with energy:
- LED lighting upgrades (2-3 year payback)
- Smart thermostats and BMS optimization
- Occupancy sensors
Investment: $2-5/SF
Savings: 10-20% reduction in operating costs
Medium-term improvements
Then the envelope and mechanicals:
- High-efficiency HVAC replacement
- Window improvements
- Rooftop solar
Investment: $10-25/SF
Savings: 20-35% reduction in operating costs
What the regulators require
Massachusetts (BERDO 2.0)
- Applies to buildings 20,000+ SF
- Emissions reduction targets through 2050
- Reporting requirements
- Penalties for non-compliance
What it looked like on a Worcester office building
Property: 50,000 SF Class B office
Baseline: ENERGY STAR score 45, $8.50/SF operating costs, $18/SF rent, 85% occupancy
Green retrofit investment: $275,000 ($5.50/SF) for LED lighting, HVAC optimization, building automation, LEED certification
After the work: ENERGY STAR score 78, $6.80/SF operating costs, $20/SF rent, 92% occupancy
| Metric | Before | After | Change |
|---|---|---|---|
| Gross Revenue | $765,000 | $920,000 | +$155,000 |
| Operating Costs | $425,000 | $340,000 | -$85,000 |
| NOI | $340,000 | $580,000 | +$240,000 |
| Value (7% cap) | $4.86M | $8.29M | +$3.43M |
The math: $3.43M in added value on a $275K investment, a 12.5x return.
Lornell Real Estate advises clients on sustainable building strategies across Central Massachusetts. Contact us to discuss ESG implementation for your portfolio.
Limitations: Market data, projections, and trend analyses reflect conditions at publication. Commercial real estate markets are inherently cyclical, and submarket and property-level performance can diverge significantly from the regional averages cited. Demographic data, employer information, and regulatory conditions are subject to change. This article does not constitute investment advice. Conduct property-specific due diligence and consult qualified professionals before making investment decisions.
Sources & References
- CBRE
This article cites data from the sources listed above. For the most current figures, consult the original publications directly.
Data current as of publication date. Market conditions, rates, and regulations may have changed. Consult a qualified commercial real estate professional before making investment decisions.
Get the full Central MA market data
Commercial tax-base growth, development activity, and demographics across Central MA, town by town.