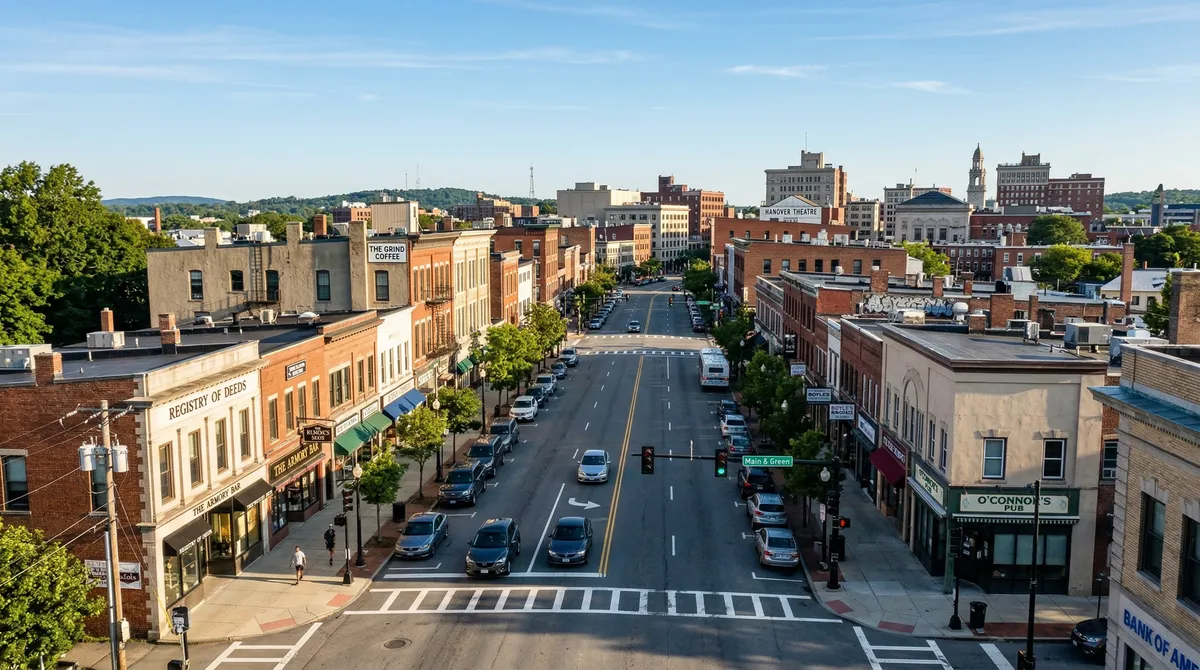
Central Massachusetts goes into 2026 in good shape across most sectors. Industrial vacancy is 4.2% with 5.8% rent growth, retail vacancy is at a 20-year low of 5.4%, and multifamily vacancy is 3.1%. Per CoStar Group, total investment volume in Central MA hit $485 million in 2025, with industrial accounting for 43% of the activity as cap rates tightened from 6.50% to 6.25%.
Industrial: 4.2% vacancy, 5.8% rent growth, and $210 million in investment volume in 2025.
Retail: vacancy at a 20-year low of 5.4% with six straight quarters of positive absorption, led by grocery-anchored space.
Multifamily: vacancy at 3.1% with 4.5% rent growth. Demand keeps outrunning supply.
Investment: $485 million in total volume in 2025, with cap rates compressing for both industrial (6.50% to 6.25%) and multifamily.
Capitalization Rate (Cap Rate) is a way to estimate the return on an investment property. You divide net operating income by current market value.
Industrial: 4.2% vacancy, 5.8% rent growth YoY, $9.25/SF NNN average rent (CoStar Group)
Retail: 5.4% vacancy (20-year low), positive absorption for 6 consecutive quarters (CoStar Group)
Multifamily: 3.1% vacancy, 4.5% rent growth, average rent $1,850/month (CoStar Group)
Investment volume: $485 million total in 2025, with cap rates compressing across industrial and multifamily (CoStar Group)
Executive Summary
Central Massachusetts starts 2026 on solid footing. Industrial fundamentals are holding, retail vacancy is at a historic low, and multifamily demand keeps outrunning supply.
Key Metrics at a Glance
| Sector | Vacancy | YoY Change | Rent Trend |
|---|---|---|---|
| Industrial | 4.2% | -0.6% | +5.8% |
| Retail | 5.4% | -0.8% | +3.2% |
| Office | 12.8% | +1.2% | -1.5% |
| Multifamily | 3.1% | -0.4% | +4.5% |
Industrial Market
Vacancy: 4.2% (down from 4.8% YoY)
Absorption: 1.8 million SF (trailing 12 months)
Average Rent: $9.25/SF NNN (up 5.8% YoY)
Outlook: I expect 4-6% rent growth in 2026. Cap rates stable at 6.0-7.0%.
Retail Market
Vacancy: 5.4% (20-year low)
Absorption: Positive for 6 consecutive quarters
Average Rent: $18.50/SF NNN (up 3.2% YoY)
Demand by Category:
| Category | Demand Level |
|---|---|
| Grocery-anchored | Very Strong |
| QSR/Fast Casual | Strong |
| Medical Retail | Strong |
| Fitness/Wellness | Moderate |
Office Market
Vacancy: 12.8% (up from 11.6% YoY)
Sublease Availability: 1.2 million SF
Average Rent: $22.50/SF gross (down 1.5% YoY)
Key Trends: Tenants keep moving to better buildings. Class A is holding at 10.2% vacancy against 18.3% for Class C.
Multifamily Market
Vacancy: 3.1% (near historic low)
Average Rent: $1,850/month (up 4.5% YoY)
| Submarket | 1BR Avg | 2BR Avg |
|---|---|---|
| Worcester Downtown | $1,650 | $2,100 |
| Shrewsbury | $1,900 | $2,400 |
| Marlborough | $2,100 | $2,600 |
Investment Market
Total Volume (2025): $485 million
| Sector | Volume | % of Total |
|---|---|---|
| Industrial | $210M | 43% |
| Multifamily | $145M | 30% |
| Retail | $85M | 18% |
| Office | $45M | 9% |
Cap Rate Trends:
| Sector | Q1 2025 | Q4 2025 | Trend |
|---|---|---|---|
| Industrial | 6.50% | 6.25% | Compressing |
| Multifamily | 5.75% | 5.50% | Compressing |
| Retail | 7.25% | 7.00% | Stable |
| Office | 8.00% | 8.50% | Expanding |
2026 Outlook by Sector
Industrial: POSITIVE - E-commerce demand, limited supply, strong rent growth
Retail: POSITIVE - Not much new supply, essential retail doing well
Office: CHALLENGING - Structural headwinds, with a few good Class A plays
Multifamily: POSITIVE - The housing shortage is not going away, and MBTA Communities is pushing new development
Key Themes for 2026
- Rate Environment: Lower interest rates are helping deals pencil
- Distressed Opportunities: Loan maturities are creating chances to buy
- Sustainability Focus: ESG requirements are working their way into decisions
- Secondary Market Appeal: Outside investors are finding value in Central MA
Lornell Real Estate publishes quarterly market reports for Central Massachusetts. Contact us for detailed market data.
Limitations: Market data, projections, and trend analyses reflect conditions at publication. Commercial real estate markets are inherently cyclical, and submarket and property-level performance can diverge significantly from the regional averages cited. Demographic data, employer information, and regulatory conditions are subject to change. This article does not constitute investment advice. Conduct property-specific due diligence and consult qualified professionals before making investment decisions.
Sources & References
- CoStar
- CoStar Group
- MBTA
This article cites data from the sources listed above. For the most current figures, consult the original publications directly.
Data current as of publication date. Market conditions, rates, and regulations may have changed. Consult a qualified commercial real estate professional before making investment decisions.
Get the full Central MA market data
Commercial tax-base growth, development activity, and demographics across Central MA, town by town.